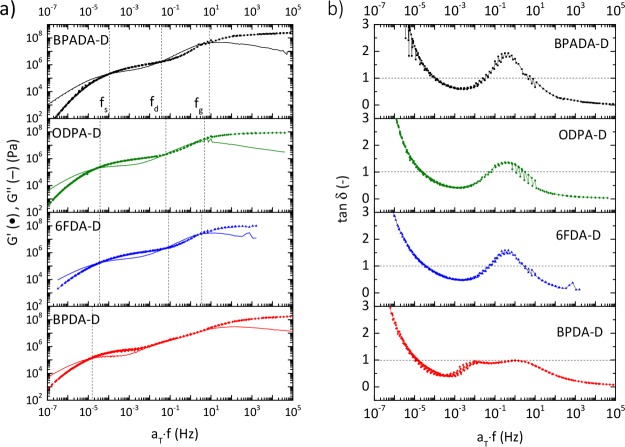
Figure 4.
TTS master curves at Tref ≈ TSH. (a) Storage modulus (G′, symbols), loss modulus (G′′, line) and (b) loss tangent (tan δ) as a function of shifted frequency (aT·f) for four PIs with different dianhydrides. Dashed lines are guidance for the eye to distinguish the regions of viscous (G′′ > G′) and elastic (G′ > G′′) dominance.

