
Figure 2. Cdk12 loss increases intronic polyadenylation (IPA) and decreases distal polyadenylation.
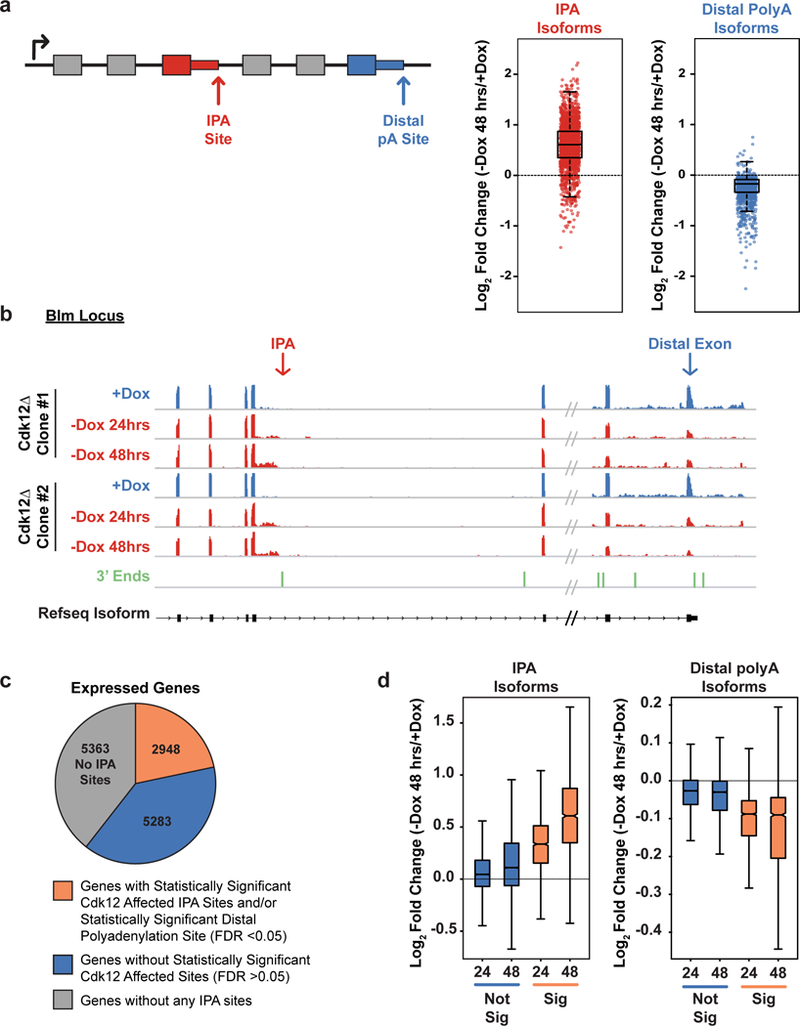
a, Left: Schematic showing an IPA and a distal polyadenylation site. Right: Log2 fold change in normalized read density (-Dox 48 hours/+Dox) for IPA isoforms (red) and distal polyadenylation isoforms (blue) reaching statistical significance (padj < 0.05). b, RNAseq read density across the 3’ end of Blm at one IPA site and at the distal exon; in Dox (blue, n=2 biological replicates per clone) or after Dox withdrawal for 24 or 48 hours (red, n=2 biological replicates per time point and clone). 3’ end sequencing read density below in green. c, Expressed genes with at least one significantly changing IPA and/or distal isoform (orange), at least one IPA isoform with no significant change in IPA or distal isoforms (blue), or genes without any identified IPA sites (grey). d, Log2 fold changes of all IPA sites (left) and all terminal sites (right) in expressed genes that change significantly upon Dox depletion for 24 or 48 hours (orange) or that do not change significantly upon Dox depletion after 24 or 48 hours (blue). (a),(d) FDR adjusted p value determined by the DEXSeq package in R; n=4 biological replicates for each condition; boxplot: median value, 25th and 75th quartiles; whiskers: 1.5x interquartile range.