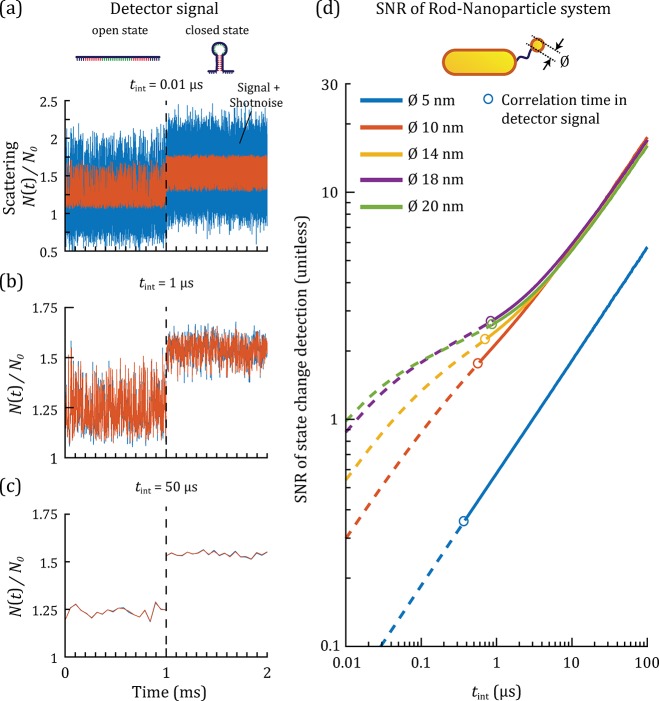
Figure 3.
(a–c) Normalized detector signal N(t)/N0 for a heterodimer (20 × 70 nm2 rod, sphere Ø 20 nm) as a function of time for three different integration times tint (a) 0.01 μs–in the shot noise limited regime, (b) 1 μs–in the intermediate regime, (c) 50 μs–in the Brownian noise limited regime. The signal due to the Brownian motion and plasmonic coupling is shown in red, and the signal with shot noise added is shown in blue. The first millisecond shows the signal of the system in the open state, the second millisecond in the closed state. (d) The SNR of the detection of a state change between the open and closed state as a function of the integration time for particle diameters of 5, 10, 14, 18, and 20 nm. The time needed by the tether particle to explore the available space in the open state, τp, is shown as open circles (see text for more details).

