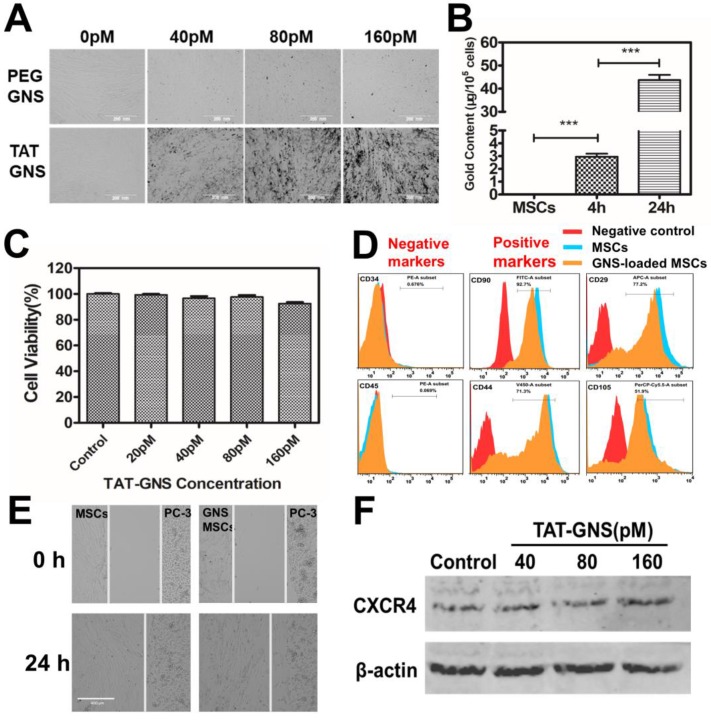
Figure 2.
Cellular uptake and the tropic migration of TAT-GNS loaded MSCs. A. MSCs cellular uptake of PEG-GNS and TAT-GNS (ranging from 0-160 pM); B. ICP-MS of Au content in MSCs incubated with 160 pM TAT-GNS during 4 h and 24 h. C. Cell viability after labeling with TAT-GNS at different concentrations ranging from 20 to 160 pM. D. FACS analyses of the surface markers of labeled and unlabeled MSCs after 24 h incubation. E. Light microscopy images showing TAT-GNS loaded MSCs migration towards PC-3 cells. F. Western blot analysis of CXCR4 expression in GNS-labeled MSCs, β-actin as control.

