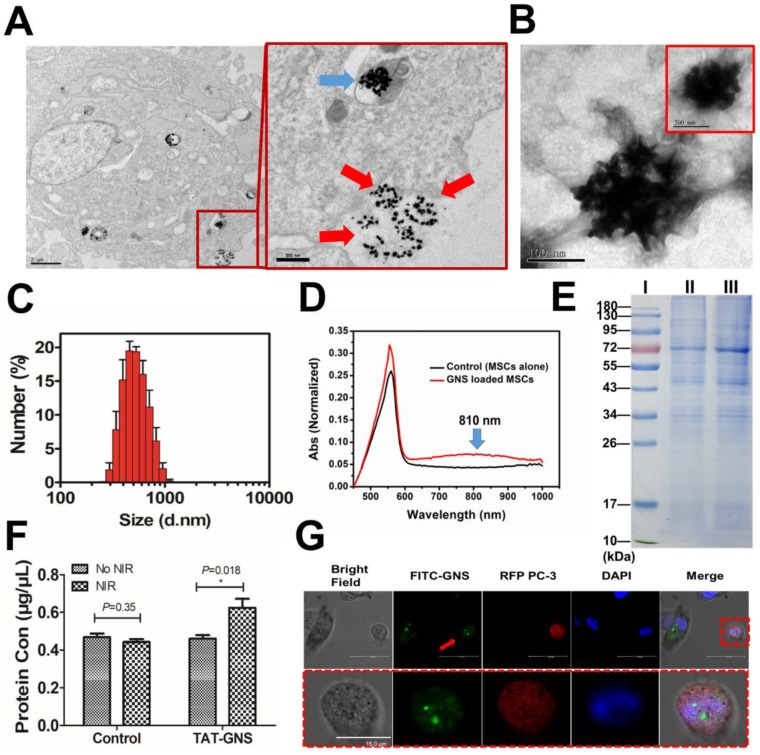
Figure 4.
Microvesicles containing GNS clusters released from GNS-loaded MSCs and their transportation to cancer cells. A. Representative images showing an intracellular GNS cluster (blue arrow) and GNS clusters exocytosis (red arrow) by GNS-loaded MSCs. B. GNS clusters produced by exocytosis from GNS-loaded MSCs in the extracellular medium. C. Size distribution of the extracellular microvesicles containing GNS clusters by DLS. D. UV-Vis-NIR spectrum of microvesicles containing GNS clusters in PBS. E. SDS-PAGE protein analysis of microvesicles containing GNS clusters. Samples were stained with Coomassie brilliant blue. I, markers. II, MSCs extracellular vesicles as control. III, GNS-loaded MSCs extracellular vesicles. F. Protein quantification of supernatant in GNS loaded MSCs by BCA assay 4 h after NIR exposure (1.5 W/cm2, 3 min). The concentration of TAT-GNS was 160 pM. G. Confocal laser scanning microscopy of FITC-labeled GNS clusters released from MSCs to PC-3 (labeled by RFP). The red arrow shows GNS clusters labeled by FITC and taken up by a PC-3 cell (labeled by RFP).

