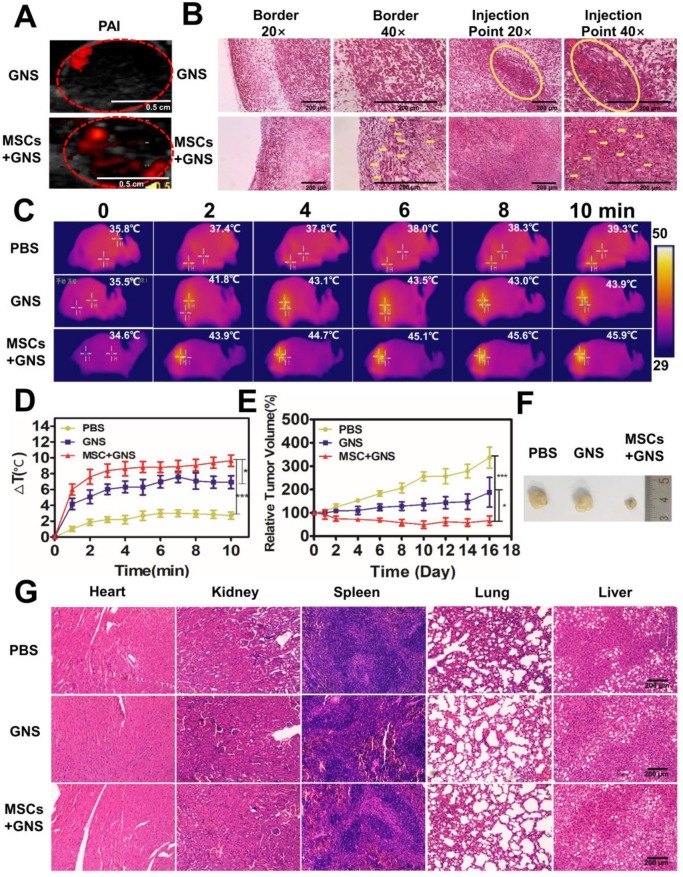
Figure 6.
Photothermal ablation of prostate tumors via GNS-loaded MSCs. A. PAI of GNS distribution after intratumoral injection. Fusion of ultrasound and PAI images of the tumors after the injection of TAT-GNS and GNS-loaded MSCs. Scale bar is 0.5 cm. B. Representative H&E and silver staining sections of the tumor after PA imaging. The yellow circles and yellow arrows noted the GNS signals (brown spots) in the sections. All scale bars are 200 μm. C. Infrared microscopic imaging: NIR laser irradiation of the tumor bearing mice after injections of PBS, TAT-GNS and GNS-loaded MSCs after 3 days. D. Temperature rise profiles at the tumor site under the 808 nm NIR laser irradiation with an intensity of 1 W/cm2 for 10 min. E. Relative tumor volume from mice intratumorally injected with PBS, GNS and GNS-loaded MSCs (n = 5) post PTT; F. Representative images of PC-3 tumors harvested from the three different groups post 16 days of laser irradiation. G. Representative H&E staining section of the mice organs after treatment for 16 days. All scale bars are 200 μm.

