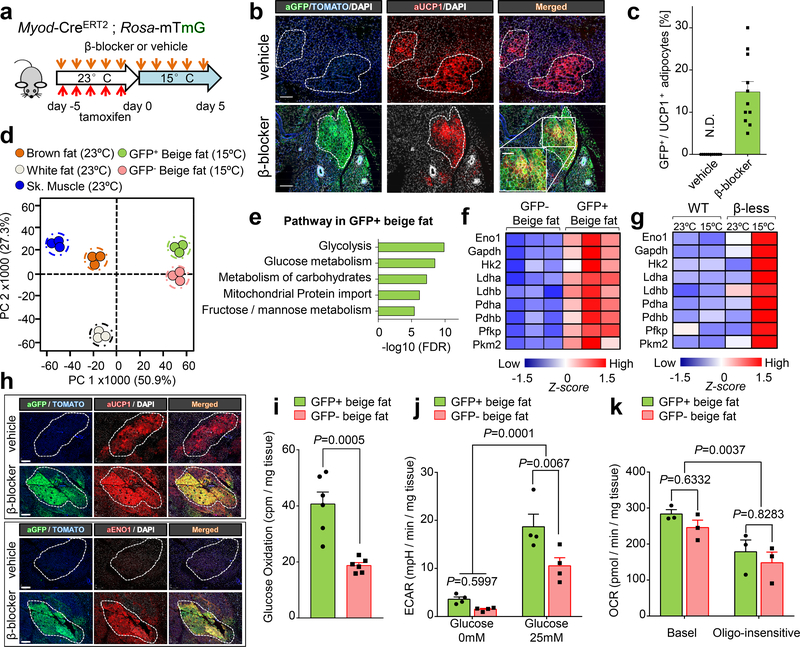
Fig.2. MyoD+ progenitors in inguinal WAT give rise to glycolytic beige fat.
a, Schematic of the experiment. b, Immuno-fluorescent staining of GFP and UCP in the inguinal WAT of mice in (a). Scale bar=100 μm. c, Quantification of GFP+ beige adipocytes among total UCP1+ adipocytes in inguinal WAT. n=11 biologically independent samples. N.D., not detected. Data are mean ± SEM. d, PCA of transcriptome from indicated tissues. n=3 biologically independent samples. e, GO analysis of enriched genes in GFP+ beige fat in (d). f, Expression of glucose metabolism genes. n=3 biologically independent samples, P<0.05 by unpaired Student’s two-sided t-test. g, Expression of glucose metabolism genes in inguinal WAT of WT and β-less mice. n=3 biologically independent samples, P<0.05 by one-way ANOVA followed by Tukey’s test. h, Immuno-fluorescent staining of GFP, UCP1, and ENO1 in inguinal WAT of Myod-CreERT2 reporter mice at 15°C. Scale bar=100 μm. i, Glucose oxidation in GFP+ and GFP- beige fat from β-blocker-treated Myod-CreERT2 reporter mice at 15°C. n=6 biologically independent samples. Data are mean ± SEM, and analyzed by unpaired Student’s two-sided t-test. j, ECAR in GFP+ and GFP- beige fat from Myod-CreERT2 reporter mice under glucose free (0mM) or high glucose medium (25mM) conditions. n=4. k, OCR in GFP+ and GFP- beige fat from Myod-CreERT2 reporter mice. n=3. (b,h) DAPI and tdTomato for counter staining. The images represent three independent experiments. (j-k) Data are expressed as mean ± SEM of biologically independent samples, and analyzed by two-way ANOVA by Bonferroni’s test adjustment.

