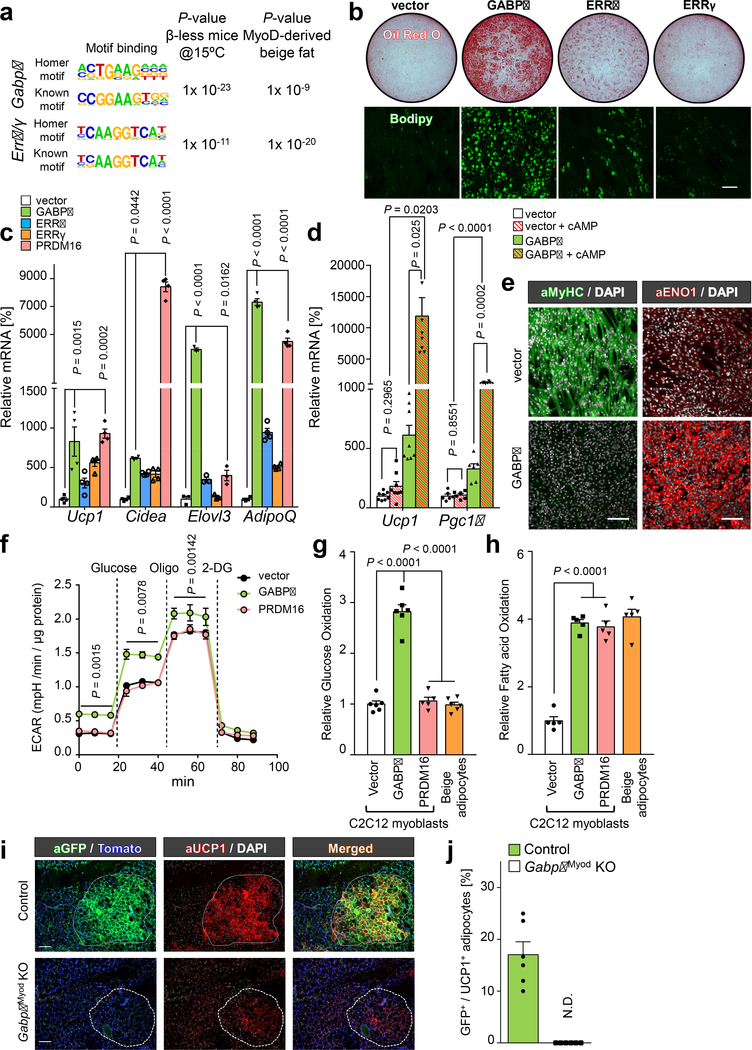
Fig.4. GABPα promotes g-beige fat differentiation in myoblasts.
a, HOMER motif analysis based on transcriptomics from β-less mice (left) and g-beige fat (right). P values represents enrichment of indicated binding motifs. b, Oil-O-Red staining and Bodipy staining of differentiated C2C12 cells expressing am empty vector or indicated factors under pro-adipogenic conditions. Scale bar=100 μm. c, mRNA expression of indicated genes in differentiated C2C12 cells. n=3–4. d, mRNA expression of Ucp1 and Pgc1α in differentiated C2C12 cells treated with or without forskolin (cAMP). n=6–8. e, Immuno-fluorescent staining of MyHC and ENO1 in differentiated C2C12 cells. DAPI for counter stain. Scale bar=100 μm. f, ECAR in differentiated C2C12 cells. n=10, biologically independent samples. Data are mean ± SEM, and analyzed by two-way ANOVA followed by Bonferroni’s test. g, Glucose oxidation in indicated cells. n=6. h, Fatty acid oxidation in indicated cells. n=5. i, Immuno-fluorescent staining of GFP and UCP1 in the inguinal WAT of control and GabpαMyod KO mice. Mice were pre-treated with β-blocker and acclimated to 15°C. tdTomato or DAPI for counter stain. Scale bar=100 μm. j, Quantification of GFP+:UCP1+ adipocytes in (i). n=6. N.D., not detected. Data are expressed as mean ± SEM. (b,e,j) The images represent three independent experiments. (c,d,g,h) Data are mean ± SEM of biologically independent samples and analyzed by ANOVA followed by Tukey’s test.

