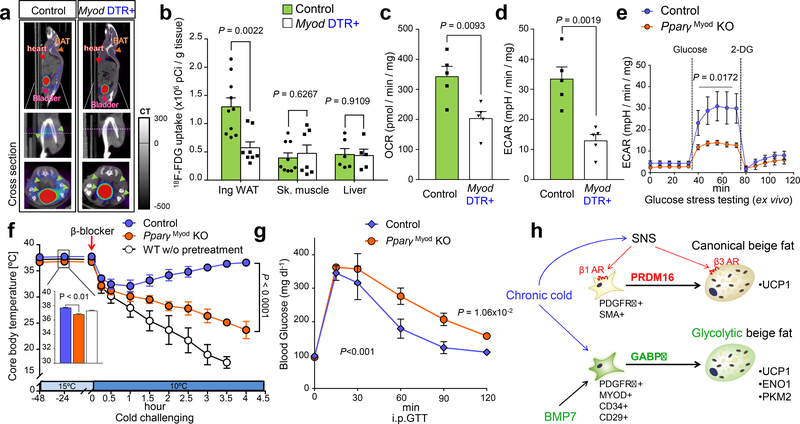
Fig.5. Requirement of g-beige fat for energy homeostasis.
d, 18F-FDG PET/CT images of control mice and Myod-DTR+ mice following cold acclimation. Green arrows indicate 18F-FDG uptake in inguinal WAT. e, Quantification of 18F-FDG uptake in indicated tissues. Inguinal WAT, Control, n=10; Myod-DTR+, n=8. In skeletal muscle, Control, n=9; Myod-DTR+, n=7. In liver, Control, n=6; Myod-DTR+, n=5. Data are expressed as mean ± SEM of biologically independent samples, and analyzed by two-sided unpaired Student’s t-test. f, OCR in inguinal WAT. n=5. g, ECAR in inguinal WAT. n=5. h, Glucose stress test in inguinal WAT of PpargMyoD KO and control mice. Glucose (25 mM) and 2-DG were added at indicated points. n=6. Data are mean ± SEM, and analyzed by ANOVA followed by Tukey’s test. i, Changes in rectal temperature during cold acclimation. Control and PpargMyoD KO mice were pre-treated with β-blocker for 5 days and acclimated to 15°C. WT mice did not receive pre-β-blocker-treatment. Acute β-blocker at the indicated arrow. Data are mean ± SD of biologically independent mice. n=6 for control mice, n=4 for PpargMyoD KO mice, and n=7 for WT mice. The inset graph: core-body temperature at 15°C. j, Glucose tolerance test in mice treated with β-blocker and acclimated to 15°C. n=7 for control, n=5 for PpargMyoD KO mice. Data are expressed as mean ± SEM of biologically independent mice. k, A mechanism of g-beige adipocyte development. see text in detail. (b,c,d) The images represent three independent experiments. (f,g) Data are mean ± SEM of biologically independent samples, and analyzed by two-sided unpaired Student’s t-test. (i,j) Data are analyzed by two-way ANOVA followed by Bonferroni’s test.

