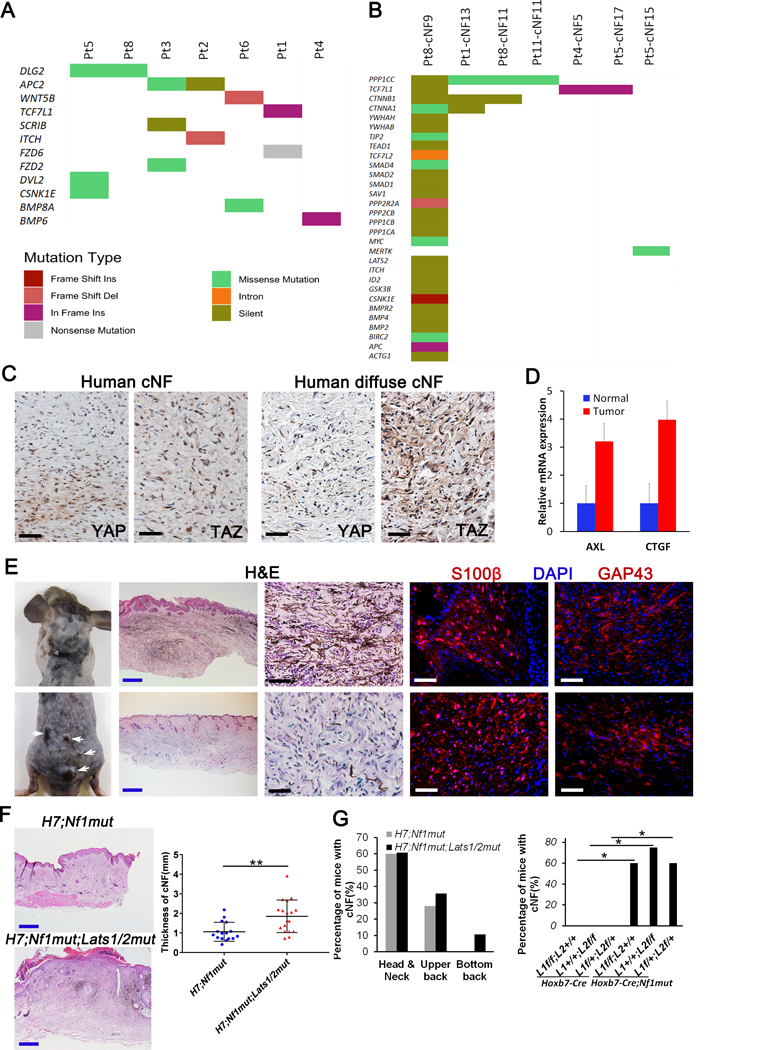
Figure 5. Hippo pathway act as a modifier of cutaneous neurofibroma.

(A-B) Hippo pathway mutation analysis of human cNF. 165 genes known to play a role in the Hippo pathway (literature search and KEGG) was used to mine genomic alterations identified in a dataset of 33 cutaneous neurofibroma collected from 9 individual NF1 patients. Hippo pathway mutations were plotted for both (A) germline (7 out of 9 patients have mutations) and (B) somatic datasets (7 out of 33 cNFs have additional somatic mutations). Colors indicate the type of mutation observed as described in the figure legend. (C) Immunohistochemistry of human discrete (upper panels) and diffuse (lower panels) cNF using anti-YAP and anti-TAZ antibodies. (D) Relative mRNA expression of AXL and CTGF by real-time PCR on 5 cNF and their adjacent normal margin. (E) Representative picture of H7;Nf1mut;Lats1/2mut mice that develop diffuse cNF (upper panel) and discrete cNF nodule (lower panel). Histological characterization of H7;Nf1mut;Lats1/2mut mice that develop diffuse cNF (upper panels) and discrete cNF nodule (lower panels) by H&E and immunofluorescence with anti-S100β and anti-GAP43 (Schwann cell markers). (F) Representative H&E used to measure the skin thickness in H7;Nf1mut (upper left panel) and H7;Nf1mut;Lats1/2mut (lower left panel). Scattered plot representing the skin thickness in function of genotype (right panel) ** = p < 0.01. (G) Bar graph representing the percentage of mice developing diffuse cNF in specific body location (left panel). Bar graph of the percentage of mice developing diffuse cNF in function of genotype * = p < 0.05 (right panel). Black and white scale bar = 50μm. Blue scale bar = 500μm. L1=Lats1. L2=Lats2.
