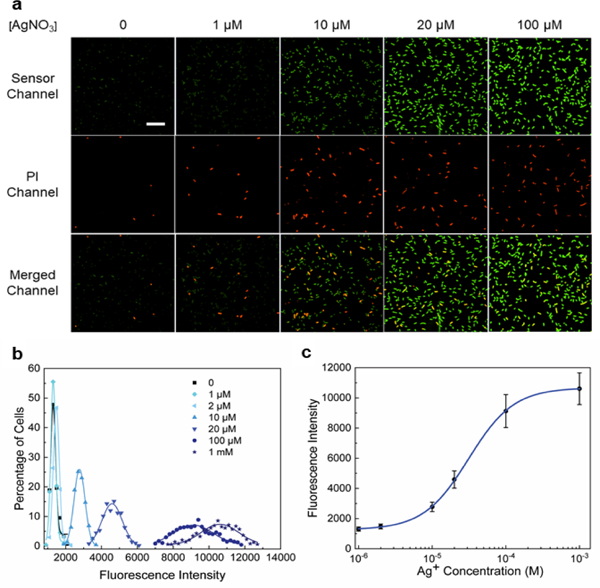
Fig. 2.

Imaging of Ag+ in live E. coli cells. (a) Confocal fluorescence imaging of S1 sensor-expressing BL21 (DE3)* cells after 2 h incubation with 0-100 μM AgNO3. The S1 sensor channel (green), propidium iodide channel (red) and merged images are shown. Scale bar: 20 μm. (b) Cellular distribution of Ag+ as indicated from S1 fluorescence intensities. Each individual cell was binned according to the brightness. The percentage of cells in each bin was plotted and fitted with Gaussian distribution curves. A total of 450 cells were measured in each case from three experimental replicates. (c) Cellular dose response curve of the S1 sensor based on the mean and S.E.M. fluorescence intensities from the Gaussian fitting.
