
Fig. 3.
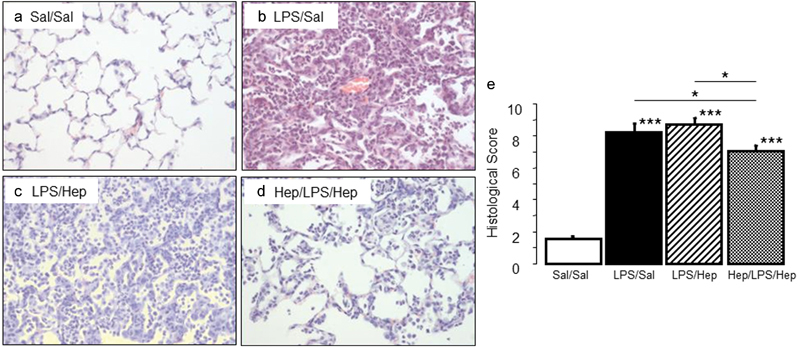
Lung tissue analysis . ( a–d ) Representative images of haematoxylin and eosin staining lung tissue sections and ( e ) histological score in animals 24 hours after induction of the injury. Original magnification ×200. Data are presented as mean ± SEM. ANOVA followed by the post hoc Fisher's PLSD test were used. * p < 0.05; ** p < 0.001; *** p < 0.0001.