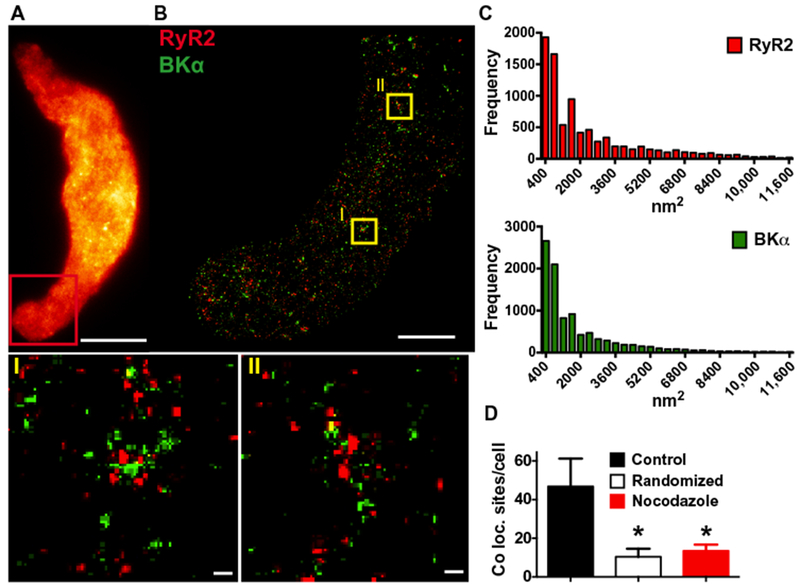
Fig. 5. Depolymerization of microtubules decreases the number of BKα and RyR2 colocalization sites.

(A) Wide-field image of a freshly isolated arterial myocyte immunolabeled for BKα (n = 12 cells, n = 3 animals). Red box indicates the area where superresolution images were obtained. Scale bar, 10 μm. (B) Superresolution localization map obtained after immunolabeling with anti-BKμ (green) and anti-RyR2 (red) antibodies (n = 12 cells, n = 3 animals). Scale bar, 3 μm. ROIs (yellow boxes) are shown in magnified view (I) and (II) below. Scale bars, 0.2 μm. (C) Cluster size distribution histograms of RyR2 and BKα (n = 11,005 or n = 11,940 particles for RyR2 and BKα, respectively; 12 cells, n = 3 animals). (D) Summary of object-based analysis to determine the number of BKα protein cluster centroids per cell that overlay with RyR2 protein clusters in control cells, cells in which a random BKα distribution has been simulated, and cells treated with nocodazole (10 μM). *P ≤ 0.05 compared to control (n =12 cells per group, 3 animals). Coloc., colocalization.
