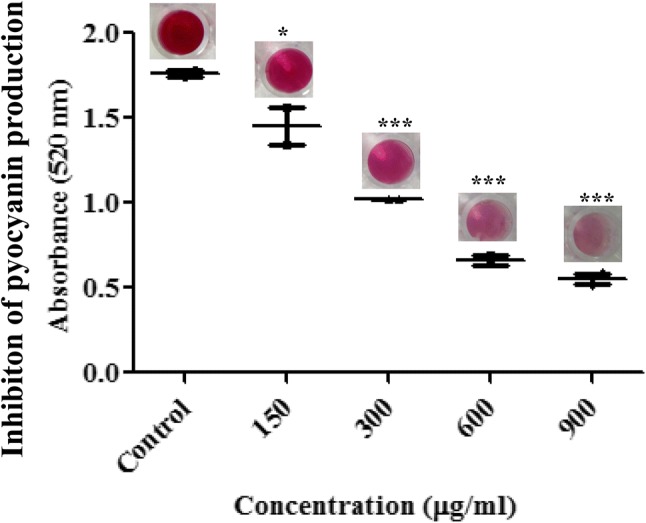
Fig. 3.

Inhibition of pyocyanin production by different concentration of EA in Pseudomonas aeruginosa. Values are represented as mean ± SD, n = 3. *P < 0.05; **P < 0.001; ***P < 0.0001

Inhibition of pyocyanin production by different concentration of EA in Pseudomonas aeruginosa. Values are represented as mean ± SD, n = 3. *P < 0.05; **P < 0.001; ***P < 0.0001