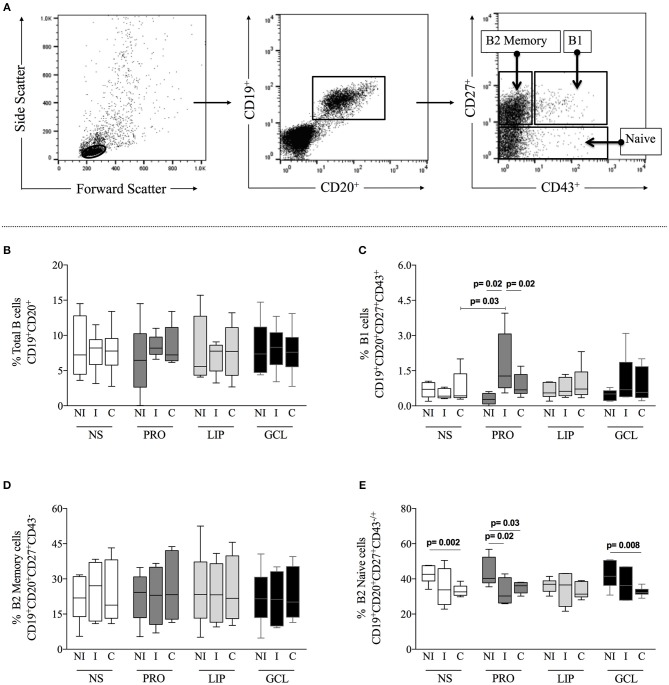
Figure 1.
Analysis of total B-cells and subpopulations. (A) Representative dot plots illustrating the gating strategy to access total B-cells (CD19+CD20+) within gated lymphocytes from total peripheral blood mononuclear cells (PBMCs), and B-cells subpopulations, B1 (CD27+CD43+), B2 Memory (CD27+CD43−) and B2 Naïve (CD27−CD43−/+) from total B-cells. PBMCs were obtained from non-infected individual (NI), indeterminate Chagas patients (I) and cardiac Chagas patients (C) and analyzed in non-stimulated cultures (NS) – white box plot, or stimulated with protein enriched fraction (PRO)- dark gray box plot, or lipid enriched fraction (LIP) - gray box plot or glycolipid enriched fraction (GCL) black box plot. (B) Analysis of the frequency of total B-cells. (C) Analysis of the frequency of total B1 cells. (D) Analysis of the frequency of total B2 Memory cells. (E) Analysis of the frequency of total B2 Naive cells. The results are expressed as percentage. The box extends from the 25th percentile to 75th percentile, with a horizontal line at the median (50th percentile). Whiskers extend from the lowest value to the 25th percentile and from the 75th percentile to the highest value, showing the range of data distribution. Statistical significance is indicated in each graph.

