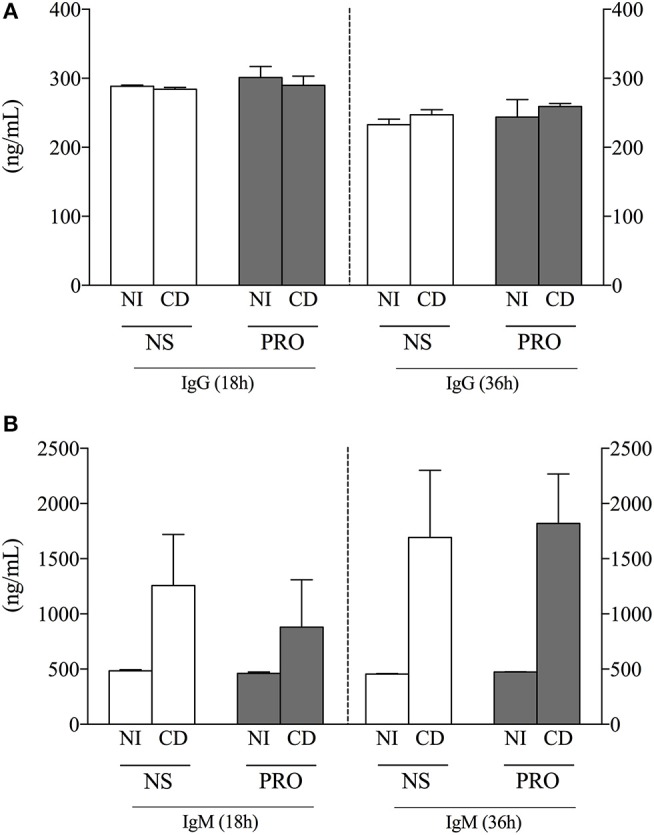
Figure 3.

Analysis of IgG and IgM production. (A) IgG concentration (ng/mL) in cell culture supernatant from non-infected individuals (NI) and Chagas patients (CD) in non-stimulated cultures (NS) and PRO stimulated cultures. (B) IgM concentration (ng/mL) in cell culture supernatant from non-infected individuals (NI) and Chagas patients (CD) in non-stimulated cultures (NS) and PRO stimulated cultures. The results are expressed as percentage in bar graphs. The bars represent the mean of individual values with standard error of the mean.
