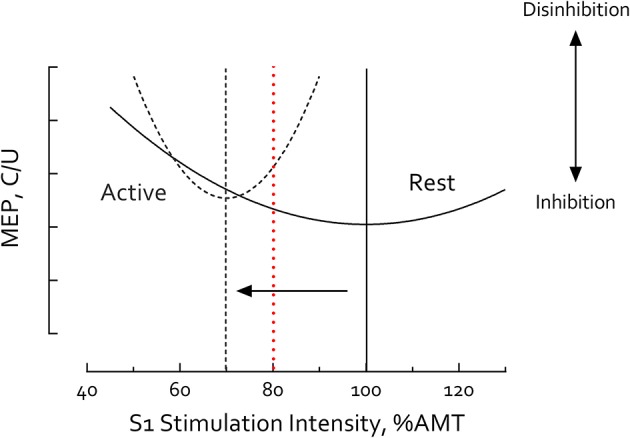
Figure 5.

S1 Intensity-Short intracortical inhibition (SICI) relationship differs between rest and motor activity. Illustrative curves constructed using results compiled from published data obtained in healthy adults (23, 46, 80, 81). S1 Intensity-SICI curve is left-shifted during motor activity (dashed line) compared to rest (solid line). Vertical lines mark the minima of each curve. At rest, the low point of the U-shaped curve (i.e., the S1 intensity inducing maximal inhibition) falls ~100% active motor threshold (AMT) or 80% resting motor threshold (RMT) (23, 25, 46, 80, 81); but during muscle contraction, the curve is left-shifted with the low point falling ~70% AMT (arrow) (46). Using S1 = 80% RMT at rest and 70% AMT during active tasks the current study revealed no significant differences between SICIrest and SICIactive in healthy controls suggesting these parameters induced maximal SICI in both conditions. Other studies have used the same S1 intensity (≥80% AMT) in both rest and active conditions (e.g., 80% AMT, red dashed line) (4, 77–79). In such cases, observation of reduced SICI during muscle contraction is not surprising, due to comparisons at different points of the resting and active S1-SICI curves. MEP, motor-evoked potential. C/U refers to conditioned MEP/unconditioned MEP. Greater C/U ratio indicates less SICI and disinhibition.
