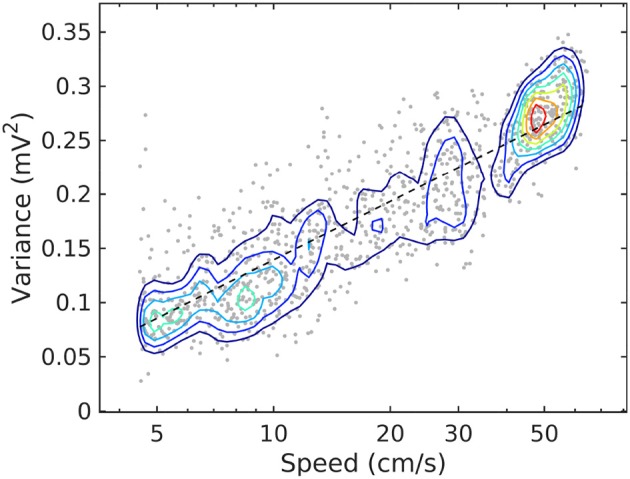
Figure 2.

Joint probability density function for LFP variance (LM) and rat speed, for rat r539♂-maurer. The dashed line is a best-fit analytical expression , with a = 0.18 and b = − 0.04. Dots represent individual realizations (1-s time segments of the LFP recording, section 2). The relation between variance and speed follows the Weber-Fechner law of stimulus perception (Fechner, 1860; Weber, 1860).
