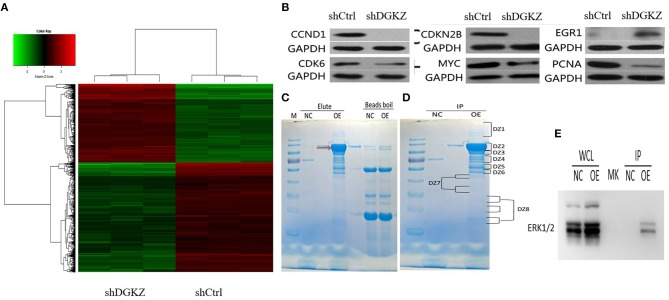
Figure 7.
Effects of DGKZ knockdown on downstream gene expression according to microarray assay and identification of DGKZ's interaction protein through LC-MS/MS analysis: (A) Heatmap representation of genes significant differential expressions in HOS cells infected with lentivirus expressing shCtrl or shDGKZ under the criteria p < 0.05 and | fold change | >1.5. Genes and samples were listed in rows and columns, respectively. A color scale for the normalized expression data was shown at the bottom of the microarray heatmap (green represents downregulated genes while red represents upregulated genes). (B) Validation of downstream gene target expression in MYC pathway by Western blot. (C) The 3 × FLAG-DGKZ interacting complex was purified using the anti-FLAG magnetic beads (Red arrow: 3 × FLAG-DGKZ). In contrast to the control (sample pulled-down from control cells), the bands only in sample pulled-down from 3 × FLAG-DGKZ cells were excised for the following in-gel trypsin digestion(NC: negative control, OE: over expression). (D) The gel band was cut into pieces and washed with Milli-Q water. The tryptic peptides were extracted from the gel pieces and lyophilized by vacuum centrifugation. (E) Through LC-MS analysis and further co-immunoprecipitation/ immunoblotting, interaction between ERK1/2 and DGKZ was confirmed in HOS cells.

