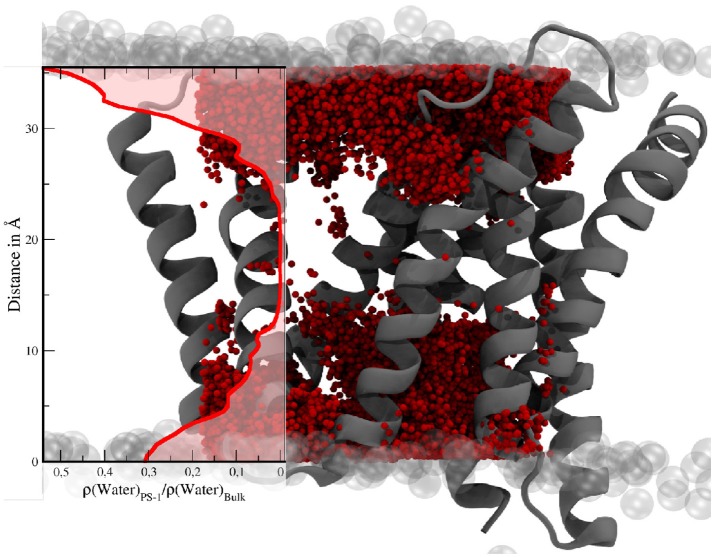
Figure 11.
Water molecules within a box of 30 × 28 × 36Å in the TM region of PS-1. The transparent gray spheres indicate the edge of the membrane domain. The red spheres are water molecules. The visualization of the water distribution has been generated by superimposing the positions of all water molecules within the given boundaries at every tenth evaluation frame of the simulation. The graph on the left shows the mean water density (Nwater/Volume) in PS-1, relative to the bulk region.

