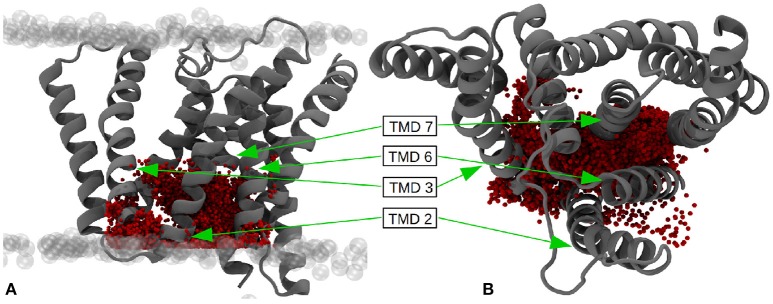
Figure 12.
(A) Water molecules within the putative binding region of the substrates (27 × 18 × 16Å) - side view. (B) Top view of the putative binding region. The pictures have been generated by superimposing the positions of all water molecules within the given boundaries at every tenth evaluation frame of the simulation. The extracellular side is at the top.

