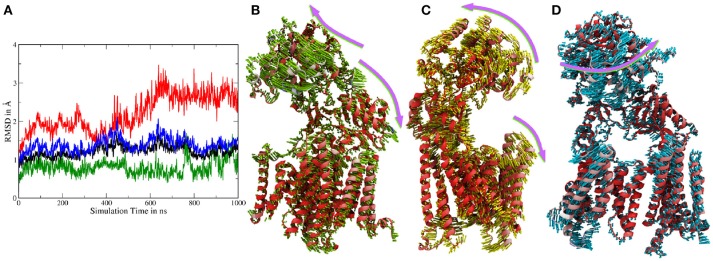
Figure 2.
(A) Cα-RMSDs calculated for system 1, with the first frame in the trajectory used as reference. Red: RMSD of complete nicastrin; green: TMD of nicastrin; black: all TMDs; blue: PS-1 TMDs. (B–D) Principal component analysis of simulation 1 (full g-sec). The mobility of each residue is depicted by the coloring scheme, ranging from red (least movement) via white to blue. The direction and extend of the movement is indicated by small arrows. Due to its high mobility, the intracellular loop 2 was not included in this evaluation in order to emphasize on nicastrin movement. (B): Mode 1. (C): Mode 2. (D): Mode 3.

