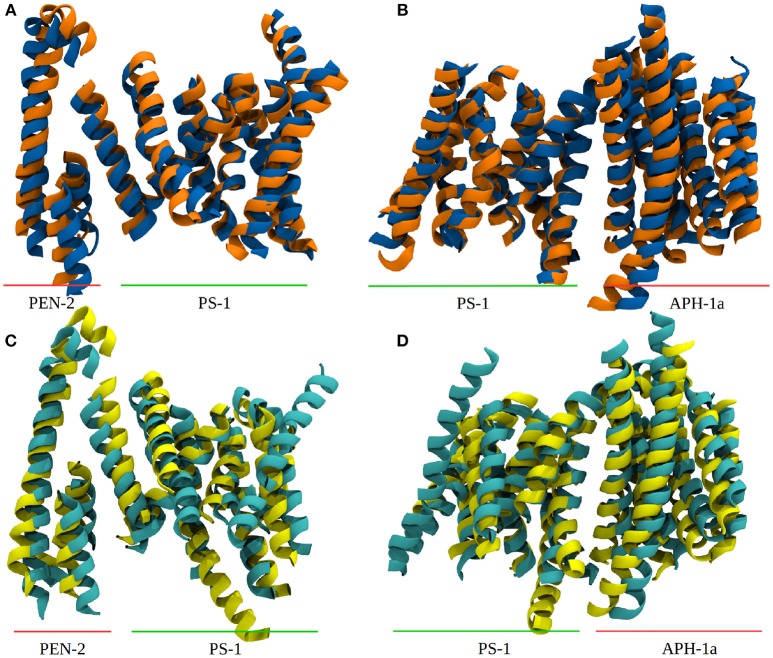
Figure 3.
Comparison between system 1 and experimental data. (A) Snapshots from system 1, depicting the “in” (blue) and “out” (orange) orientation of Pen-2 by superposition. (B) APH-1a tilting with respect to PS-1 in system 1. (C,D) Depiction of PDB structures 5FN3 (cyan, class 1) and 5FN5 (yellow, class 3) exhibiting very similar structural diversity. The structures were aligned at the Cα atoms of PS-1 TMDs 1, 5, 8, and 9.

