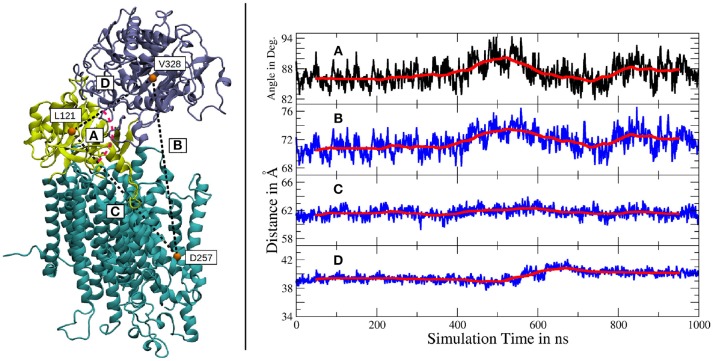
Figure 4.
Left panel: Location of the amino acids used for subdomain distance measurements. The large lobe is colored in iceblue, the small lobe in yellow and the intramembrane domains of g-sec are depicted in cyan. Right panel: (A) Angle between V328, L121 and D257. (B) Distance between V328, situated in the large lobe and D257, one of the catalytically active aspartates. (C) Distance change between the small lobe (L121) and the PS-1 active site (D257). (D) Distance change between the two ectodomain lobes (L121 and V328). The scaling is the same for all distance plots and a running average (100 points averaging window) has been added for greater clarity (red lines).

