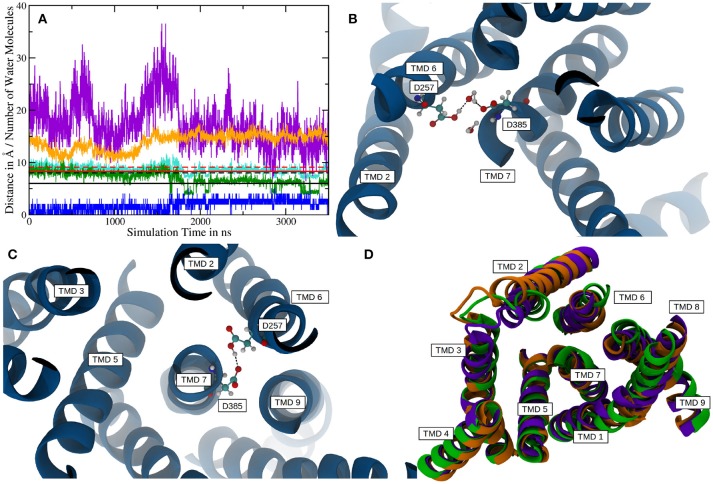
Figure 5.
(A) Plot depicting distances between certain residues and the number of water molecules within PS-1 in system 2. The Cα distance between D257 and D385 is shown in cyan with the mean distances for the active (solid line) and inactive (dashed line) given in red. The green plot represents the sampled distances between the Cγ atoms of the catalytic aspartates and the black lines indicate the mean separation in the inactive (dashed) and active (solid) states. The distance between V142 (TMD 2) and S169 (TMD 3) is depicted in orange. The blue line is the number of water molecules within 4Å of D257 and D385 and the purple plot indicates the number of water molecules inside the putative substrate binding area of PS-1. Please note, that the purple graph has been scaled down by a factor of two in order to increase comparability. (B) The active site aspartates are bridged via a water molecule at Cα distances of 8.6 ± 0.4Å. (C) At a Cα separation of 7.5 ± 0.3Å the two catalytic side chains are forming a hydrogen bond. (D) Superposition of the mean structures of inactive PS-1 (system 2, green), active PS-1 (system 2, purple) and system 1 (orange). View from the intracellular side.

