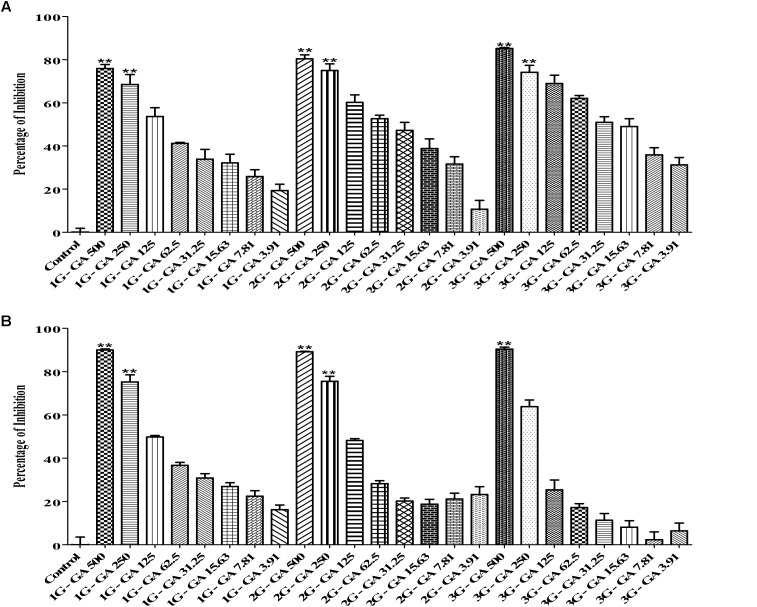
FIGURE 4.
Determination of the MICs of gallic acid against the 1G, 2G, and 3G cell of M. haemolytica (A) and the 1G, 2G and 3G cells of P. multocida (B), which had been pre-exposed to tulathromycin at 1/2MIC concentration for one, two, and three times, respectively. The concentration of gallic acid was ranging from 3.9 to 500 μg/mL. One way ANOVA t-test was used for statistical significance. ∗P-value < 0.05, ∗∗P-value < 0.01, and ∗∗∗P-value < 0.001 are shown. Correlation coefficient (r) was calculated using Pearson’s correlation method.

