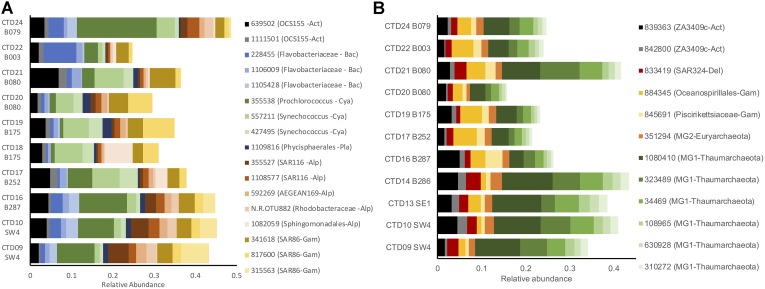
FIGURE 2.
Relative abundance (proportion of OTU sequences) of dominant taxa (>1% mean relative abundance) in the SRF (A) and MESO (B). Taxa are grouped by taxonomy: Act, Actinobacteria; Alp, Alphaproteobacteria; Arc, Archaea; Bac, Bacteroidetes; Cya, Cyanobacteria; Del, Deltaproteobacteria; Euk, microbial eukaryotes; Gam, Gammaproteobacteria; Pla, Planctomycetes.

