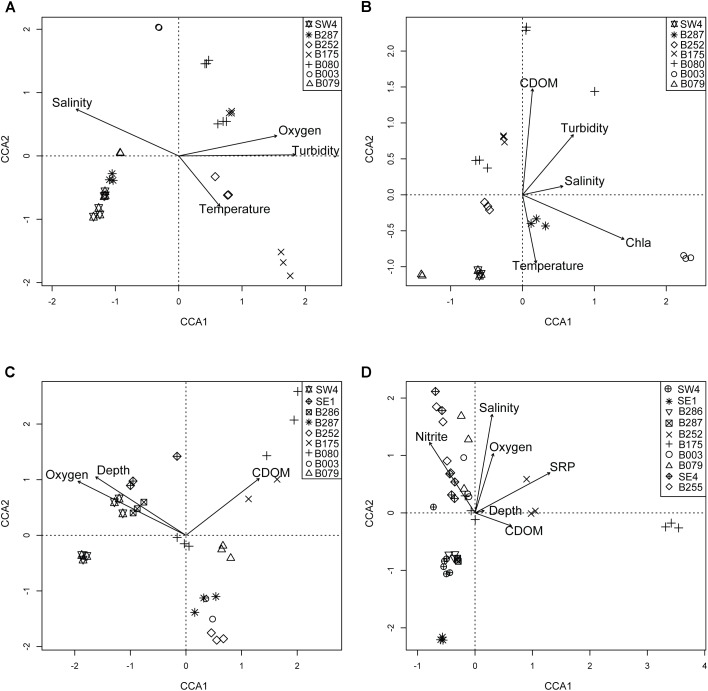
FIGURE 4.
Triplots of individual pelagic depth zones in DP02: SRF (A), DCM (B), MESO (C), BATHY (D). Symbols represent unique sampling stations. Vectors in plots represent direction and magnitude of influence for labeled environmental parameter. Specific environmental influences varied across depths, and thus different combinations of environmental variables are shown for each depth bin.

