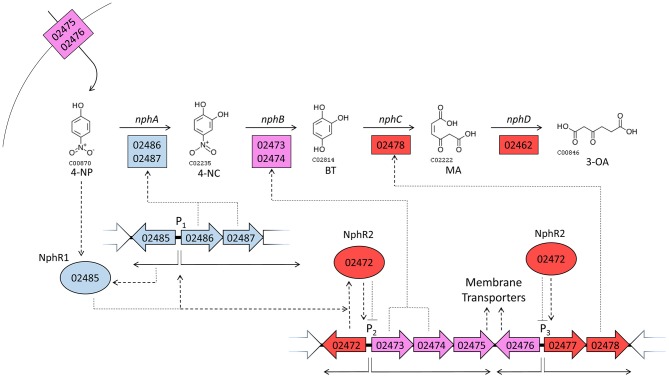
Figure 5.
A model of gene regulatory events during growth on 4-NP. Large arrows with internal numbers represent genes with BUPNP1 locus tag numbers. Transcription from promoter regions (P) 1, 2 and 3 are shown as thin solid arrows, while translation and regulatory interactions are shown as dotted arrows. Positive relationships are pointed arrows, negative interactions have blunt arrowheads. Enzymes are shown as rectangles, regulatory proteins as ovals. The color of genes/proteins reflects their expression during growth in 4-NP relative to expression during growth in glucose. Blue genes/proteins are induced (positive FC in Table 3) at 6 h in 4-NP, but then uninduced by 12 h (insignificant FC). Purple genes/proteins are on at 6 h (insignificant FC), but repressed by 12 h (negative FC). Red genes/proteins are not induced at 6 h (insignificant FC), but are induced at 12 h (positive FC). Thus, blue and purple genes are expressed more at 6 h than at 12 h, while red genes are more highly expressed at 12 h than at 6 h. See discussion section A Model for the Regulation of 4-NP Degradation by BUPNP1 for a detailed description of the model.

