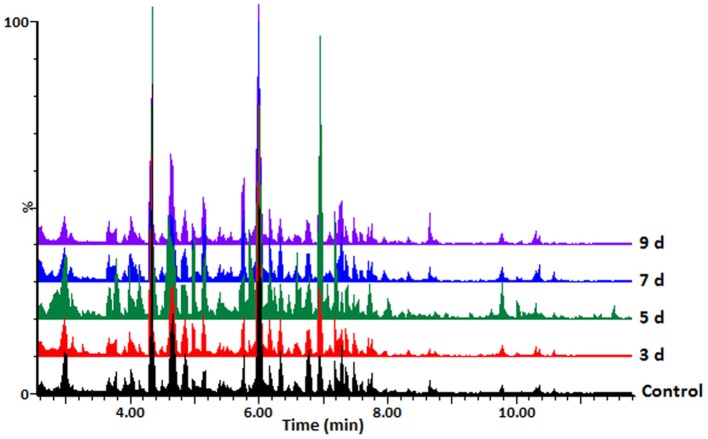
Figure 1.
UHPLC-MS BPI chromatograms (ESI negative data): typical mass chromatograms of extracts from the sorghum NS 5511 (BTT) cultivar leaf tissue samples, responding to fungal infection. Control refers to samples from non-infected plants. The 3–9 d.p.i. samples are also indicated. Visual inspection of these mass chromatograms shows resolution of a number of ion peaks, reflecting the complexity of the extracts. Differential peak populations point to treatment-related metabolic changes: for instance in the retention time range of 4–8min, where differential peak intensities can be seen, and presence or absence of peaks.

