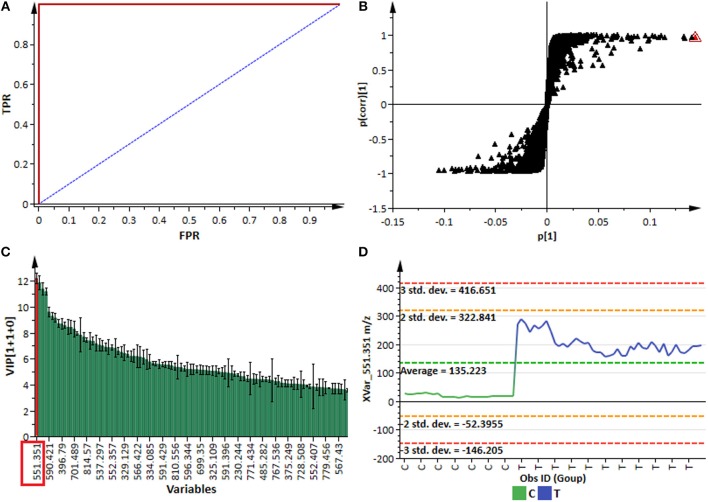
Figure 3.
OPLS-DA modeling and variable/feature selection (data from NS 5511/ BTT cultivar samples). (A) A typical receiver operator characteristic (ROC) plot for the OPLS-DA model (ESI negative data) separating “control vs. infected plants” at 7 d.p.i. (1 + 1 + 0 components, R2X = 0.611, Q2 = 0.994, CV-ANOVA p-value = 2.4 × 10⁻¹⁴). The ROC plot is a graphical summary of the performance of a binary classifier. A model with perfect discrimination has a ROC curve with 100% sensitivity and 100% specificity, as it is the case with this OPLS-DA model. (B) An OPLS-DA loadings S-plot for the same model in (A); variables situated in the extreme end of the S-plot are statistically relevant and represent prime candidates as discriminating variables/features. (C) A variable importance for the projection (VIP) plot for the same model; pointing mathematically to the importance of each variable (feature) in contributing to group separation in the OPLS-DA model. (D) A typical variable trend plot (of the selected variable in VIP and S-plots), displaying the changes of the selected variable across the samples. C = control; and T = treated samples (7 d.p.i.). The variable trend plot show that the selected feature significantly discriminates the treated from the control samples.

