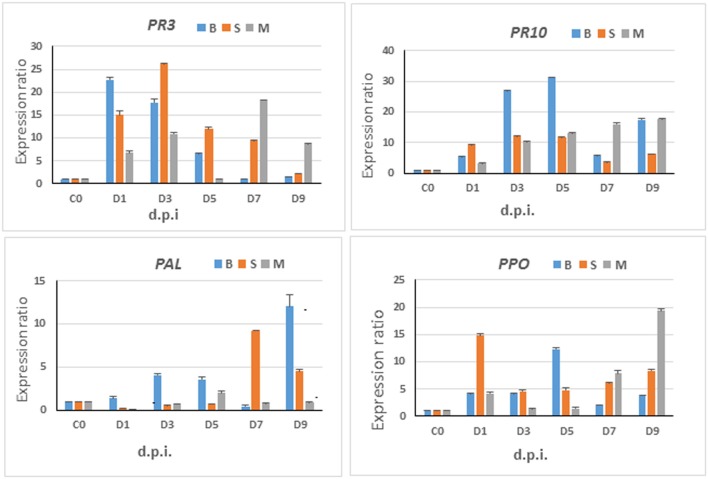
Figure 8.
Gene expression analyses—relative expression of selected marker genes. Time-course studies of relative expression of PAL, PPO, PR3, and PR10 genes in sorghum plants infected by C. sublineolum. M = Mhlophe/MHL, B = NS 5511/BTT, and S = NS 5655/SWT cultivars. Bars indicate the mean values and error bars indicate the standard deviation. Results were analyzed using ANOVA, with confidence level of 95% and significance level at p = 0.05.

