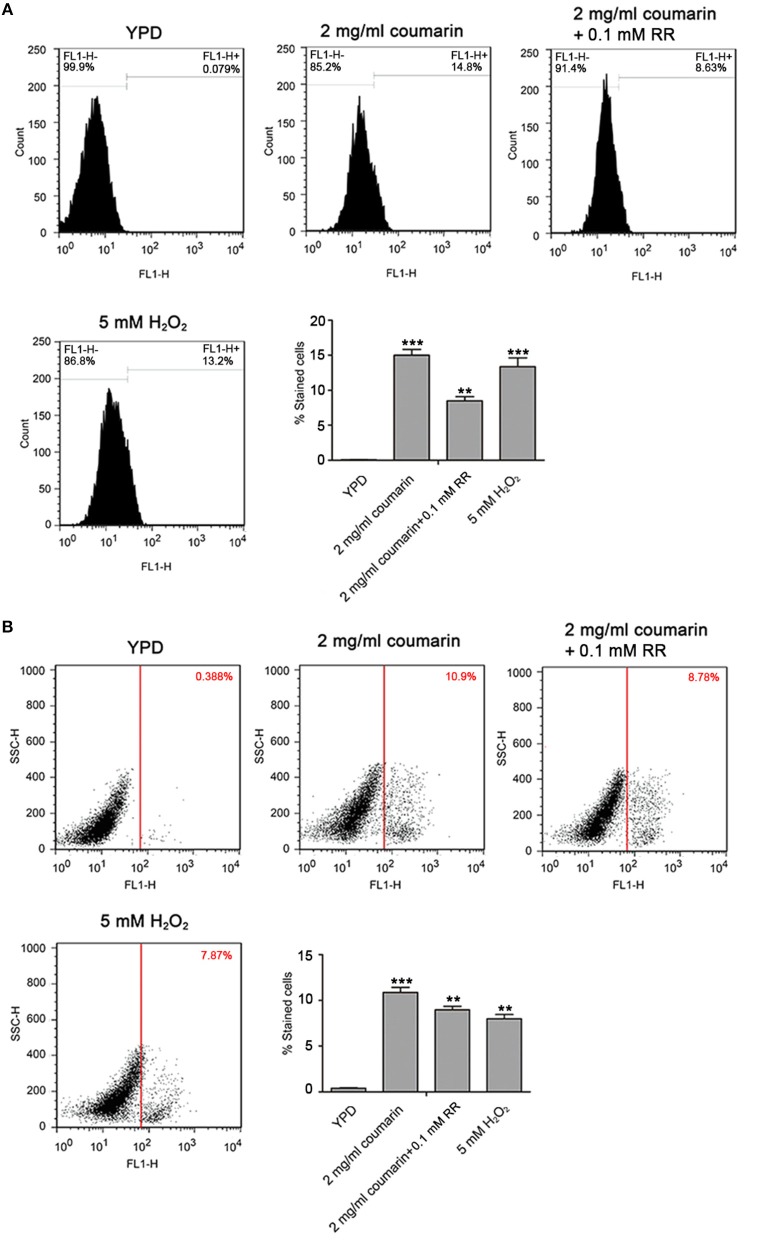
Figure 6.
Coumarin triggered apoptosis associated with mitochondrial Ca2+ influx. (A) DNA fragmentation was analyzed using TUNEL staining. The histogram displayed the percentage of stained cells, and the values were exhibited as mean ± SD, **P < 0.01 and ***P < 0.001. (B) Metacaspase activity was evaluated using FITC-VAD-FMK assay. The percentage of stained cells was shown in the histogram, and the data were displayed as mean ± SD. **P < 0.01 and ***P < 0.001.

