1.
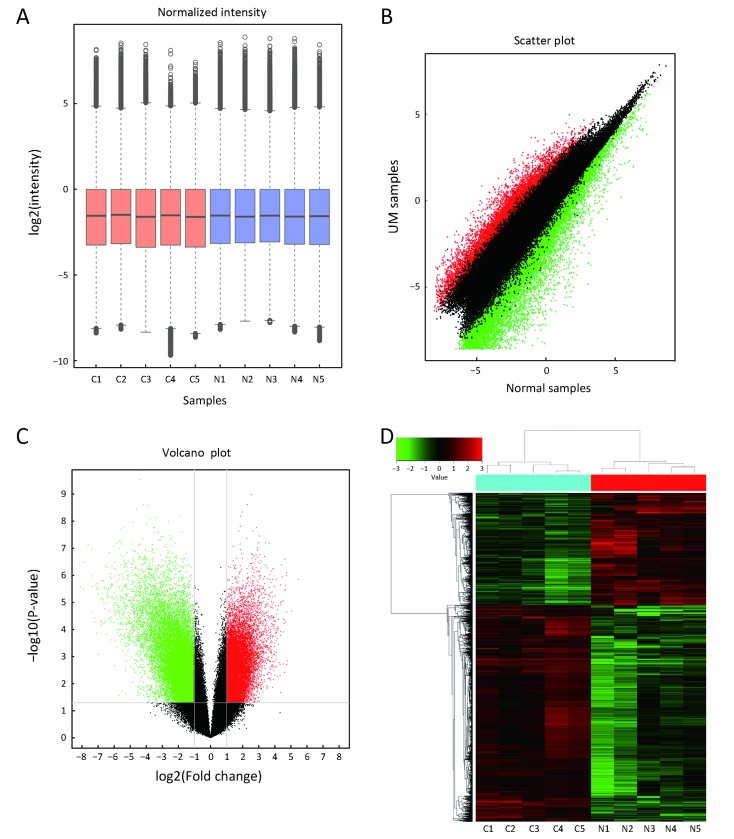
Overview of microarray data of circular RNA (circRNA) expression profiles in uveal melanoma (UM) samples and normal uvea samples. (A) A box plot displaying normalized intensity distributions in the tumor and normal tissue samples (C: cancer tissue; N: normal uvea tissue); (B) Scatter plot showing the difference in circRNA expression between the UM (Y-axis) and normal samples (X-axis). The values in the scatter plot are the averaged normalized signal values of samples (log2 scaled). Red points represent up-regulated circRNAs with FC≥2.0 in UM tissues, and green points represent down-regulated circRNAs with FC≥2.0; (C) Volcano plot of the differentially expressed circRNAs. Red points represent up-regulated circRNAs, and green points represent down-regulated circRNAs. The vertical lines demark the fold change (FC) values, which correspond to 2.0-fold up and down. The horizontal line marks a P-value of 0.05; (D) A heat map of cluster analysis demonstrating the different circRNA expression profiles between five UM samples (C1, C2, C3, C4 and C5) and five normal uvea samples (N1, N2, N3, N4 and N5). The log2 signal intensity is reflected in the color scale that runs from green (low intensity) to red (high intensity), and the color bar in the upper left corner represents a comparison table of numbers and colors.

