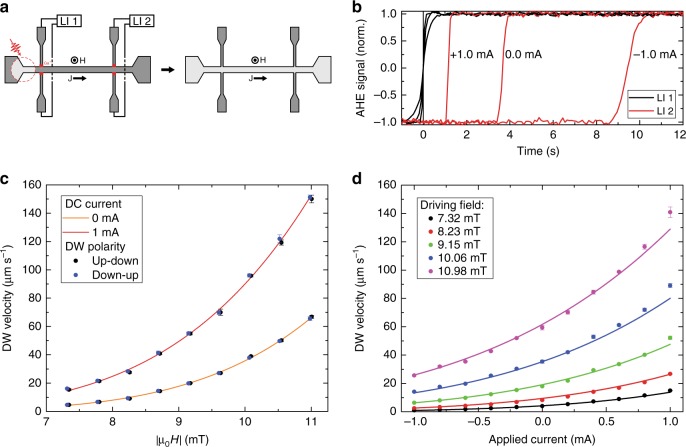
Fig. 3.
Field-driven-SHE-assisted DW velocity measurements. a Schematic overview of the field-driven-SHE-assisted DW motion measurement on the Pt/Co/Gd wire. The AHE signal in the Hall crosses is measured using lock-in amplifiers LI 1 and LI 2. The red dotted circle illustrates the region exposed by the laser pulse, and the red blocks indicate the regions exposed to Ga+ ion irradiation. b Typical time-of-flight measurements for three different applied current amplitudes, showing the normalized AHE signal in both Hall crosses as a function of time. The step in the signal from −1 (down) to +1 (up) indicates that the DW is passing the specific Hall cross. c DW velocity for both DW polarities as a function of the driving field amplitude with 0 and +1 mA of DC current sent through the wire [direction indicated in (a)]. The solid lines represent fits to the data following the creep law [Eq. (1)]. d DW velocity as a function of the current sent through the wire for different driving fields. Solid lines represent fits to the data using Eq. (1). Error bars in (c, d) correspond to the standard deviation of the mean using 5 measurements for each data point

