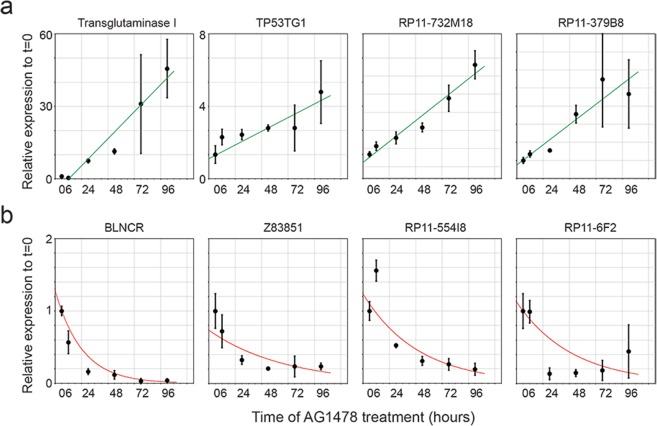
Figure 2.
Time-course induction of differentiation using AG1478 shows different expression kinetics. (a)Expression dynamics of upregulated terminal differentiation marker TGM1 and lncRNAs TP53TG1, RP11-732M18 and RP11-379B8 over time. Expression is shown relative to T = 0. n = 3 (b) Expression dynamics of downregulated lncRNAs BLNCR, Z83851, RP11-554I8 and RP11-6F2 over time. The expression is shown relative to T = 0. n = 3, mean −/+ SD.

