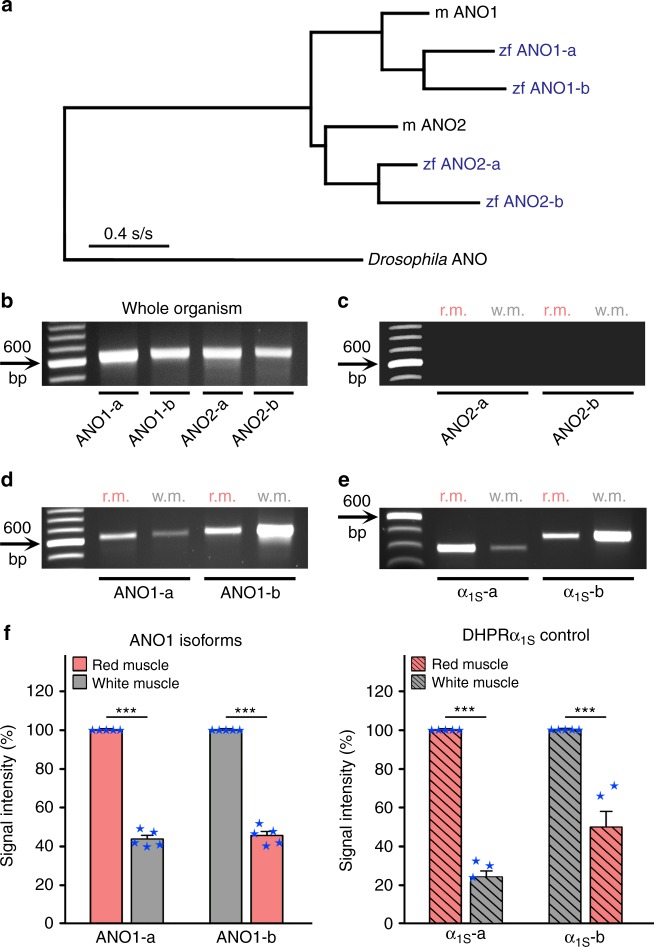
Fig. 3.
Two distinct ANO1 isoforms are expressed in red and white skeletal muscle of zebrafish. a Likelihood-based phylogenetic tree (Treefinder, version 2011) from aligned amino acid sequences of mouse (m) ANO1 (GenBank accession no. NP_848757), zebrafish (zf) isoforms ANO1-a (accession no. XP_009301746) and ANO1-b (accession no. XP_017209649), mouse ANO2 (accession no. NP_705817), zebrafish isoforms ANO2-a (accession no. XP_009298253) and ANO2-b (accession no. XM_009293432), with the ancestral Drosophila ANO channel (accession no. NP_648535) as outgroup, shows species-independent isoform clustering. Likelihood score, −16,906.7; edge lengths optimised. Scale bar, evolutionary distance in substitutions per site (s/s). b RT-PCR amplification from first strands of whole adult zebrafish with primers specific for all 4 ANO channel isoforms (Supplementary Table 1) showed signals with similar intensity (P > 0.05, n = 5) for RNAs that were isolated from adult normal zebrafish. c RT-PCR amplification with ANO2-specific primers under identical PCR conditions did not show any signal, neither from red muscle (r.m.) nor white muscle (w.m.). d In contrast, ANO1-specific primers amplified PCR fragments from both muscle types but to different extents. e Similarly, control PCR amplifications with DHPα1S-specific primers detected both, α1S-a and α1S-b in both tissues but again to different extents. f Left graph, quantification of band intensities of ANO1 isoforms revealed that ANO1-a is predominantly expressed in the red muscle compared (P < 0.001) to white muscle (43.75 ± 1.89%, n = 5), and ANO1-b is mainly expressed in the white muscle compared (P < 0.001) to red muscle (45.56 ± 2.08%, n = 5). Right graph, DHPRα1S-a and α1S-b, known to be exclusively expressed in red and white muscles, respectively4, displayed a similar cross-contamination pattern for DHPRα1S-a in white (24.21 ± 3.12%; n = 5) and DHPRα1S-b in red muscle (49.90 ± 8.09%; n = 5). Bars represent mean ± s.e.m. and overlaying blue stars indicate individual data points; *** P < 0.001 determined by unpaired Student’s t-test

