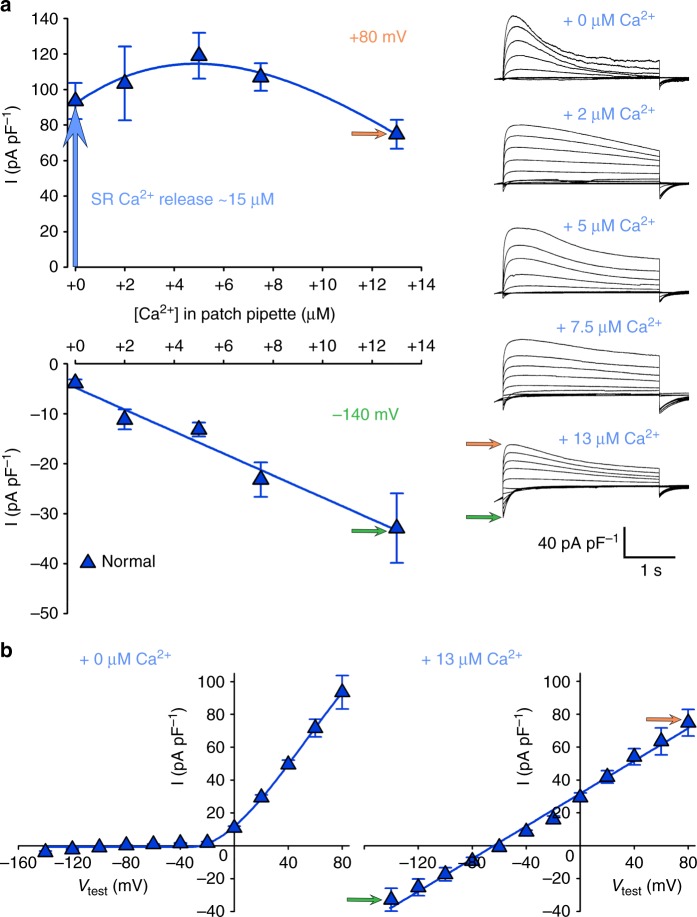
Fig. 6.
ANO1 outward current is activated close to maximum by SR Ca2+ release. a Ca2+-concentration dependence experiments of ANO1 currents were performed by elevating cytosolic Ca2+ concentrations via perfusion with the patch pipette solution from the physiological level (+0, n = 5) to +2 (n = 5), +5 (n = 9), +7.5 (n = 5), and +13 µM (n = 8). Plots of Ca2+ dependence of the outward Cl− current at +80 mV (top graph) and Ca2+ dependence of the inward Cl− current at −140 mV (bottom graph) are shown. Vertical blue arrow indicates Cl− current stimulation by SR Ca2+ release, which raises cytosolic Ca2+ to ~ 15 µM52. Representative recordings of ANO1 currents (3-s pulse protocol) at different elevations of intracellular Ca2+ concentrations are depicted on the right. Scale bars, 1 s (horizontal), 40 pA pF−1 (vertical). b Current–voltage relationship under physiological conditions i.e., +0 Ca2+ addition (n = 5, left graph) and after addition of +13 µM Ca2+ to the cytosol (n = 8, right graph). Orange arrow indicates Imax at +80 mV and green arrow at −140 mV. Data are presented as mean ± s.e.m.; P determined by unpaired Student’s t-test

