Fig. 9.
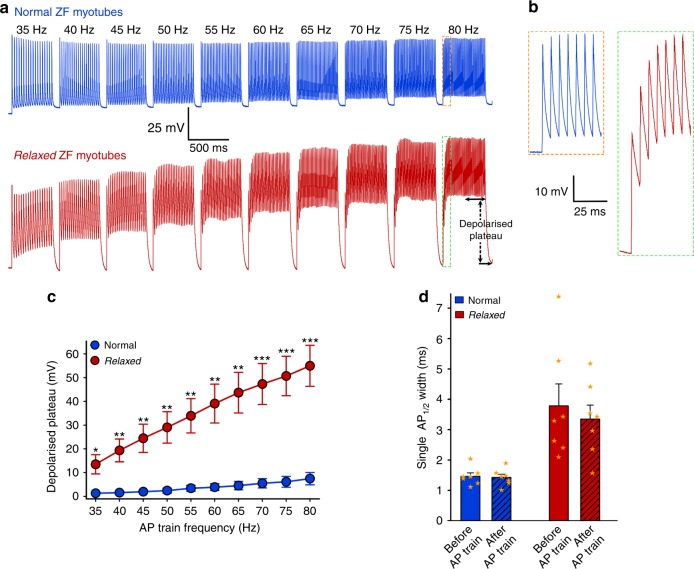
The ANO1 current facilitates proper skeletal muscle spike trains. a Representative recordings of 500-ms trains of APs from normal (upper traces) and relaxed (lower traces) myotubes at increasing stimulations frequencies from 35 to 80 Hz in 5-Hz increments with 100-ms inter-train intervals. Relaxed myotubes display pronounced depolarised plateaus in a frequency-dependent mode due to the summation of broader APs. For calculating the size of depolarised plateaus, the second half of the 500-ms AP trains (indicated by a horizontal double-headed arrow) was taken into consideration. Vertical dashed arrow symbolizes the size of the depolarised plateau at 80 Hz. Scale bars, 500 ms (horizontal), 25 mV (vertical). b Train of APs on an expanded time base showing piling up of broader APs in relaxed myotubes (red trace) compared to normal myotubes (blue trace) during the initial phase of the 80-Hz train. Scale bars, 25 ms (horizontal), 10 mV (vertical). c Depolarised plateau sizes were significantly different at all tested frequencies between relaxed (n = 8) and normal (n = 7) myotubes. d Mean single AP½ width before and after the AP train recordings from the same set of normal and relaxed myotubes. Mean AP½ width was indistinguishable (P > 0.05) when recorded before or after the trains of APs in normal (1.46 ± 0.11 ms; 1.43 ± 0.10 ms; n = 7) as well as in relaxed (3.79 ± 0.72 ms; 3.35 ± 0.46 ms; n = 7) myotubes. However, the difference in AP½ width was highly significant (P < 0.01) between normal and relaxed myotubes, regardless if recorded before or after the trains of APs. Data are presented as mean ± s.e.m. and overlaying orange stars indicate individual data points; *P < 0.05, **P < 0.01, ***P < 0.001 determined by unpaired Student’s t-test

