Fig. 5.
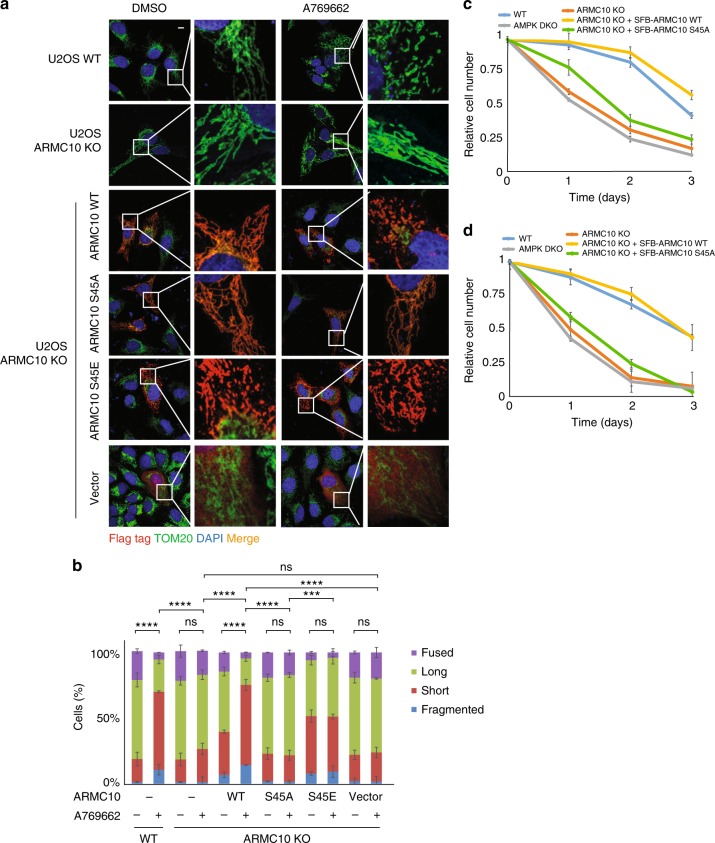
Mitochondrial morphology changes in ARMC10-KO cells. a Results of immunostaining experiments using wild-type (WT) ARMC10 or ARMC10-KO U2OS cells treated or not treated with AMPK A769662 300 μM for 1 hour. Dimethyl sulfoxide (DMSO) was used as control. The rescue experiments were done with transiently expressed ARMC10 WT, S45A mutation, and S45E mutation. The green signal indicates the mitochondrial marker TOM20, and the blue signal indicates DAPI/nuclei. Scale bar: 10 μm. b Quantification of mitochondrial morphology in WT ARMC10 and ARMC10-KO U2OS cells. Morphology was quantified as for Fig. 4b, d. c, d Cell survival following glucose starvation. HEK293A-derived cells (c) or U2OS-derived cells (d) were cultured in 25 mM glucose-containing medium for 24 h and then changed to a medium without glucose. Cells were counted at each time point (mean ± standard deviation; n = 3 biologically independent extracts) and plotted

