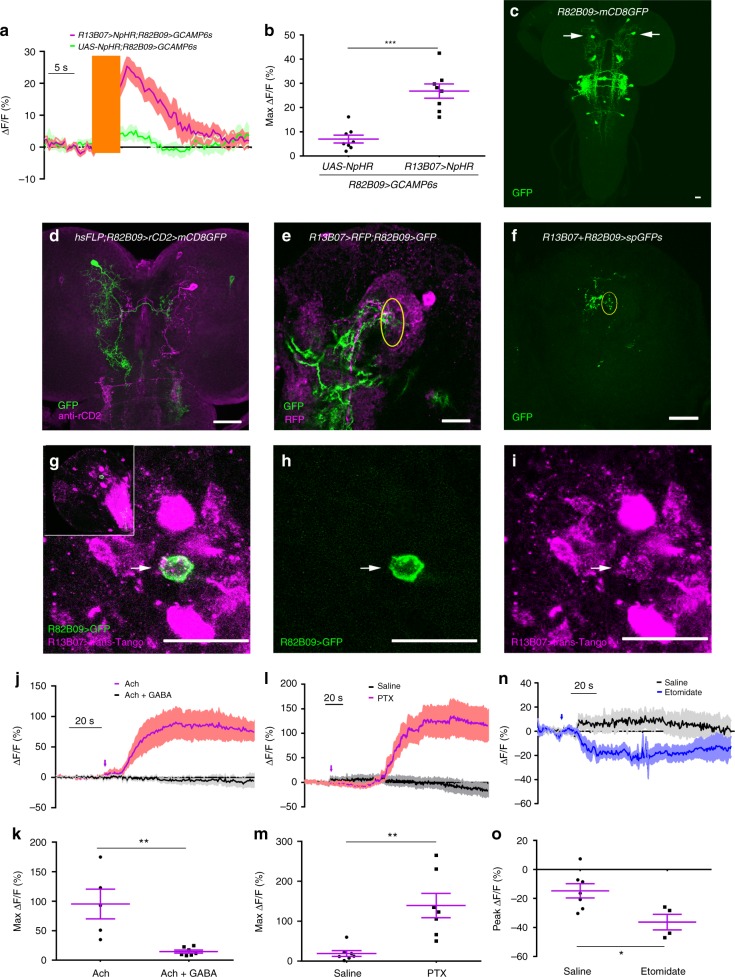
Fig. 2.
RDL on CLPNR82B09s mediates the inhibition from LRINR13B07s a–b. Optogenetic inhibition of LRINR13B07s allows excitation of CLPNR82B09s. b is the statistics of peak calcium responses in a. The orange bar indicates the 540 nm light stimulation. The genotypes are R82B09-LexA/UAS-NpHR; LexAop-GCAMP6s/+ and R82B09-LexA/UAS-NpHR; R13B07-Gal4/ LexAop-GCAMP6s. c Expression pattern of R82B09-Gal4 in larval brain. Arrows point to cell bodies of CLPN R82B09s. d Morphology of single CLPNR82B09 labeled by R82B09-Gal4. e Co-localization between the dendrites of CLPNR82B09 and LRINR13B07 in larval brain. Yellow circle outlines the overlapping region between LRINR13B07 and CLPNR82B09. f GRASP signal between CLPNR82B09 and LRINR13B07. Yellow circle outlines verified contact region. g–i trans-Tango probes CLPNR82B09 as immediate downstream of R13B07-Gal4 labeled neuron. g is the merged version of h and i. trans-Tango signal is in magenta. GFP signal driven by R82B09-Gal4 is in green. Arrows indicated the overlapping between trans-Tango signal and GFP signal that labels the cell body of a CLPNR82B09. Inset in g shows the position of the co-localization in larval brain hemisphere. UAS-myrGFP,QUAS-mtdTomato(3xHA)/+;trans-Tango/+;R13B07-Gal4/R82B09-Gal4 is the genotype of the larva used. trans-Tango signals are reported by 3xHA. j–k Application of 100 mM GABA repressed the activation of CLPNR82B09s by 100 μM acetycholine. h is the statistics of peak calcium responses in g. l–m Application of 100 μM RDL antagonist picrotoxin allows excitation of CLPNR82B09s. j is the statistics of peak calcium responses in i. n–o Calcium response in CLPNR82B09s before and after etomidate application. Arrow indicates application of drug. o is the statistics of peak responses in n. Scale bars, 20 μm in c–i. Samples in j–o were prepared from larvae of genotype R82B09-LexA;LexAop-GCAMP6s. Arrows indicate application of drugs in j, l, and n. *P < 0.05, **P < 0.01, ***P < 0.001, t-test in b, k, m, and o. Error bars, SEMs. Source data of a–b and j–o are provided as a source data file

