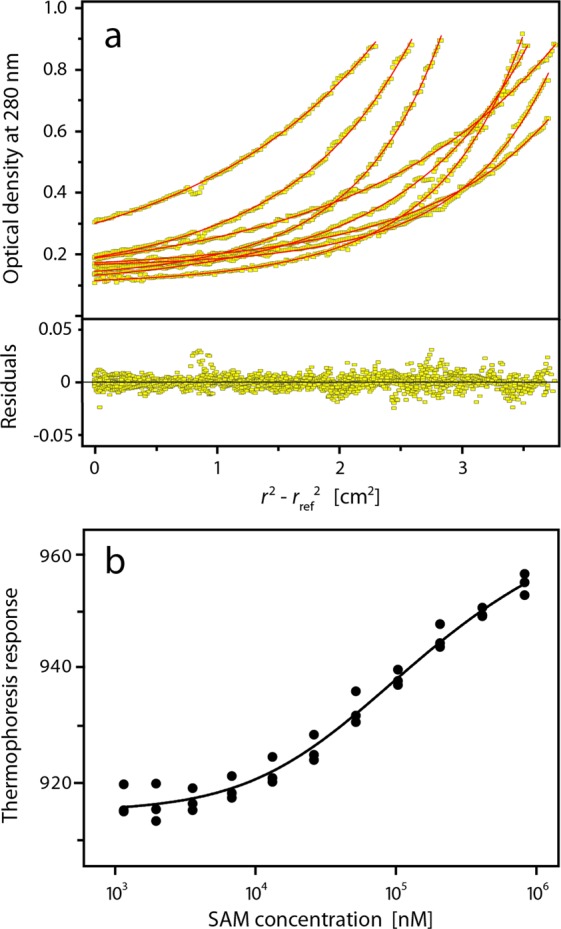
Figure 1.

Analysis of the SLy1 SAMwt monomer-dimer equilibrium. (a) Sedimentation equilibrium experiments were performed using samples with different SAMwt concentrations (60, 120, and 300 µM) at different speeds. Data were fit globally with a monomer-dimer model. The upper panel shows concentration profiles recorded after establishment of equilibrium between sedimentation and back diffusion and the calculated concentration distributions (red lines) based on a monomer-dimer equilibrium model. The global fit gives a Kd = 117 (33, 423) μM. The lower panel shows the residuals of the fit. (b) Binding isotherm from microscale thermophoresis data. The thermophoresis response of fluorescent labelled SAMwt is dependent on the total concentration of SAMwt. The experimental data were fit to a monomer-dimer equilibrium model (solid line) with a Kd of (153 ± 25) μM.
