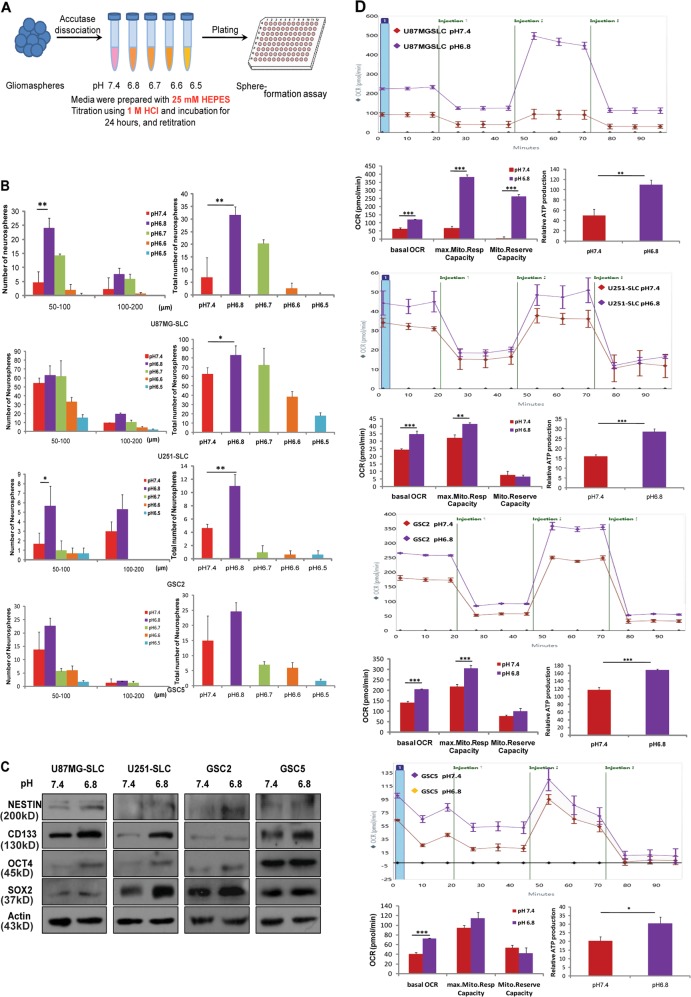
Fig. 1. Acidic microenvironment drives self-renew and mitochondrial metabolism.
a Schematic diagram of pH treatment of SLCs. Adding 25 mM HEPES buffer into the culture medium. The pH values of the medium were set as 7.4, 6.8, 6.7, 6.6, and 6.5. Using neurosphere formation assay to detect the effect of different pH values on the sphere formation ability of SLCs. b Neurosphere formation assay to determine the best pH value for the self-renewal of SLCs. The volume and number of neurospheres (diameters larger than 50 µm) of U87MG-SLC, U251-SLC, GSC2, and GSC5 under pH 7.4, 6.8, 6.7, 6.6, and 6.5 conditions (*P < 0.05; **P < 0.01, Student’s t-test). c Immunoblotting of the expression of stemness markers NESTIN, CD133, OCT4, and SOX2 in pH 7.4-treated and pH 6.8-treated U87MG-SLC, U251-SLC, GSC2, and GSC5 cells. d Respiration of mitochondria in SLCs/7.4 (red) and SLCs/6.8 (purple) U87MG-SLC, U251-SLC, GSC2, and GSC5 cells treated with oligomycin, FCCP, Antimycin A, and Rotenone. Oxygen consumption rate of basal respiration (basal OCR), maximal respiration (max. Mito. Resp Capacity), spare respiratory capacity (Mito.Reserve Capacity), and ATP production were shown (bottle panel; *P < 0.05; **P < 0.01; ***P < 0.001, Student’s t-test)

