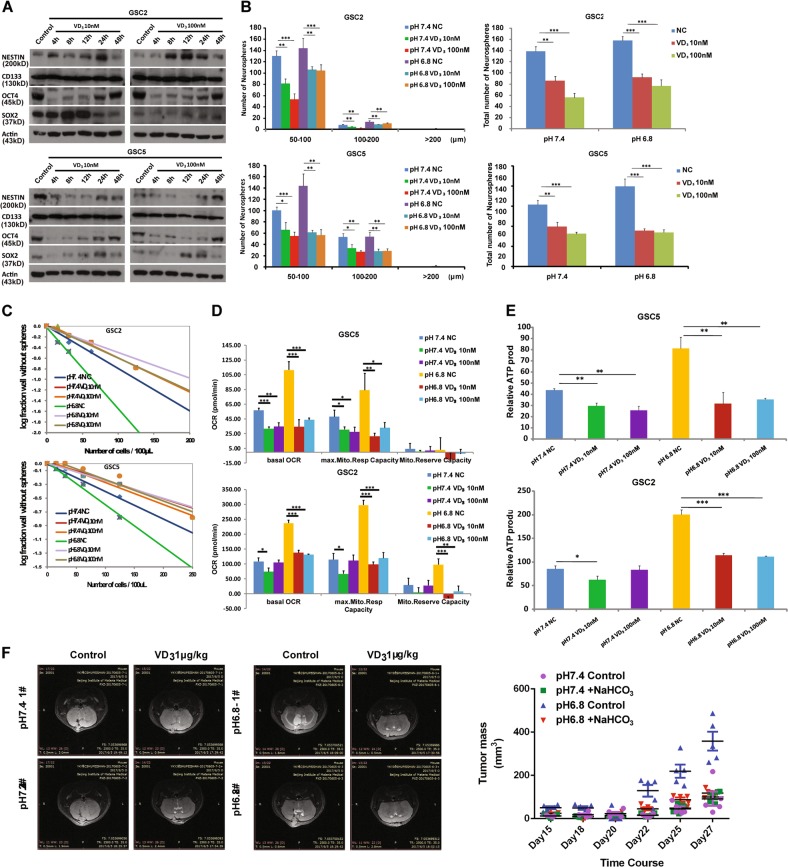
Fig. 5. 1α,25(OH)2D3 inhibited the stemness and impaired the mitochondrial respiration and ATP production in acidic condition.
a Immunoblotting of the expression of stemness markers NESTIN, CD133, OCT4, and SOX2 in GSC2 and GSC5 cells that were treated with 1α,25(OH)2D3 10 or 100 nM for 4, 8, 12, 24, and 48 h. b and c Self-renewal ability of SLCs with 1α,25(OH)2D3 treatment under pH 7.4 or pH 6.8 culture conditions. Neurosphere formation assay showed the number of neurospheres (diameters larger than 50 µm) formed from GSC2 and GSC5 cells that were treated with 1α,25(OH)2D3 10 or 100 nM (b), *P < 0.05; **P < 0.01; ***P < 0.001, Student’s t-test. Limiting dilution assay of pH 7.4-treated and pH 6.8-treated GSC2 and GSC5 cells were diluted into 250, 125, 62.5, 31.25, 15.625, and 0 per 100 μL that were treated with 1α,25(OH)2D3 10 or 100 nM. Wells not containing spheres (diameter that are larger than 50 μm) for each cell plating density was calculated after 2 weeks (c). d and e Respiration of mitochondria in GSC2 and GSC5 cells that were treated with 1α,25(OH)2D3 10 or 100 nM for 4 h under pH 7.4 or pH 6.8 culture conditions. Oxygen consumption rate of basal respiration (basal OCR), maximal respiration (max. Mito. Resp Capacity), spare respiratory capacity (Mito. Reserve Capacity), and ATP production were shown. *P < 0.05; **P < 0.01; ***P < 0.001, Student’s t-test. f The photos of magnetic resonance imaging of pH 7.4-treated or pH 6.8-treated GSC2 xenografts in nude mice treated intraperitoneally 6 days a week from day 5 with 1 μg/kg 1α,25(OH)2D3, Sesame oil was used as control (n = 5). g Tumor growth of pH 7.4 or pH 6.8-treated GSC2 xenografts. Sterile water was used as control to treat pH 7.4 (purple) or pH 6.8 (blue)-treated GSC2 xenografts, NaHCO3 was subcutaneously injected in pH 7.4 (green)-treated or pH 6.8 (red)-treated GSC2 xenografts (n = 5). pH 7.4 control vs. pH 6.8 control, P = 0.0012; pH 6.8 control vs. pH 6.8 + NaHCO3, P = 0.0006; Student’s t-test

