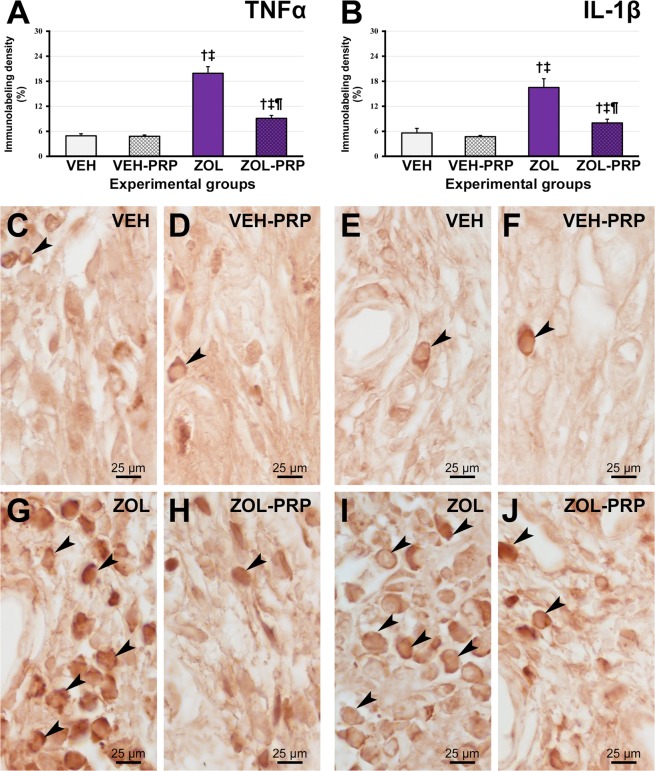
Figure 2.
Immunolabeling pattern for TNFα and IL-1β in tooth extraction site. (A,B) Graphic presenting immunolabeling data for TNFα (A) and IL-1β (B) in tissue of extraction site in the different experimental groups at 28 postoperative days. (C–J) Photomicrographs showing immunolabeling pattern for TNFα (C,D,G,H) and IL-1β (E,F,I,J) in VEH (C,E), VEH-PRP (D,F), ZOL (G,I) and ZOL-PRP (H,J). Symbols: arrows, immunolabeling cells; †statistically significant difference in relation to VEH; ‡Statistically significant difference in relation to VEH-PRP; ¶Statistically significant difference in relation to ZOL. Original magnification: 1000×. Scale bars: 25 μm.

