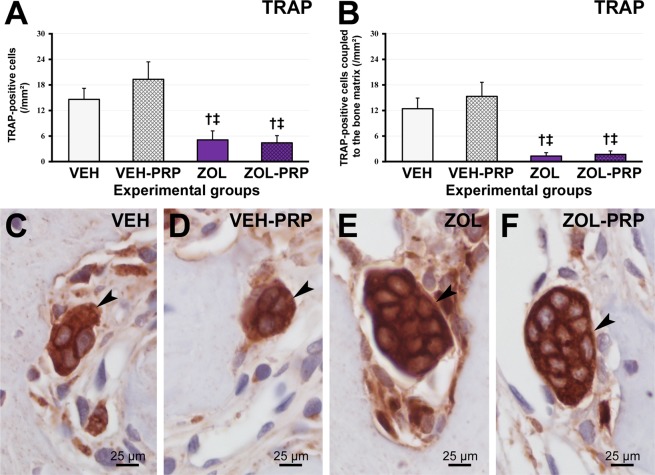
Figure 5.
Immunolabeling pattern for TRAP in tooth extraction site. (A–B) Graphics presenting TRAP-positive cells (A) and TRAP-positive cells coupled to the bone matrix (B) in tooth extraction site in the different experimental groups at 28 postoperative days. (C–F) Photomicrographs showing immunolabeling pattern for TRAP in VEH (C), VEH-PRP (D), ZOL (E) and ZOL-PRP (F). Symbols: arrows, immunolabeling cells; †Statistically significant difference in relation to VEH; ‡Statistically significant difference in relation to VEH-PRP; ¶Statistically significant difference in relation to ZOL. Original magnification: 1000×. Scale bars: 25 μm.

