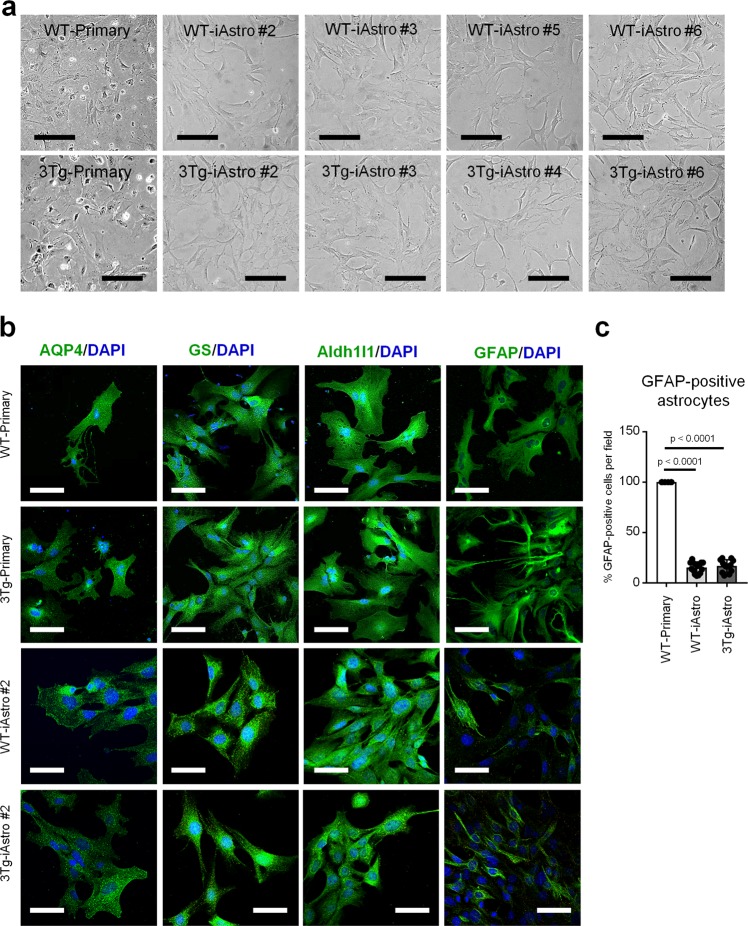
Fig. 1. Characterization of WT- and 3Tg-iAstro lines.
a Phase contrast images of four WT-iAstro and four 3Tg-iAstro lines at passage 15. Bar, 100 μm. b Immunofluorescence images of WT-iAstro#2 and 3Tg-iAstro#2, stained with anti-AQP4, anti-GS, anti-Aldh1l1 and anti-GFAP antibodies. Bar, 50 μm. The images shown in (a, b) are representative of n = 3 independent experiments. c Quantification of GFAP-positive cells in WT-iAstro#2 and 3Tg-iAstro#2 lines. Data expressed as mean ± SD % of 15 fields of GFAP-positive cells evaluating a total of 359 WT- and 514 3Tg-iAstro cells. In (b, c), other characterized independently generated iAstro lines show similar results in immunostaining of astroglial markers and in quantification of GFAP-positive cells (data not shown)

