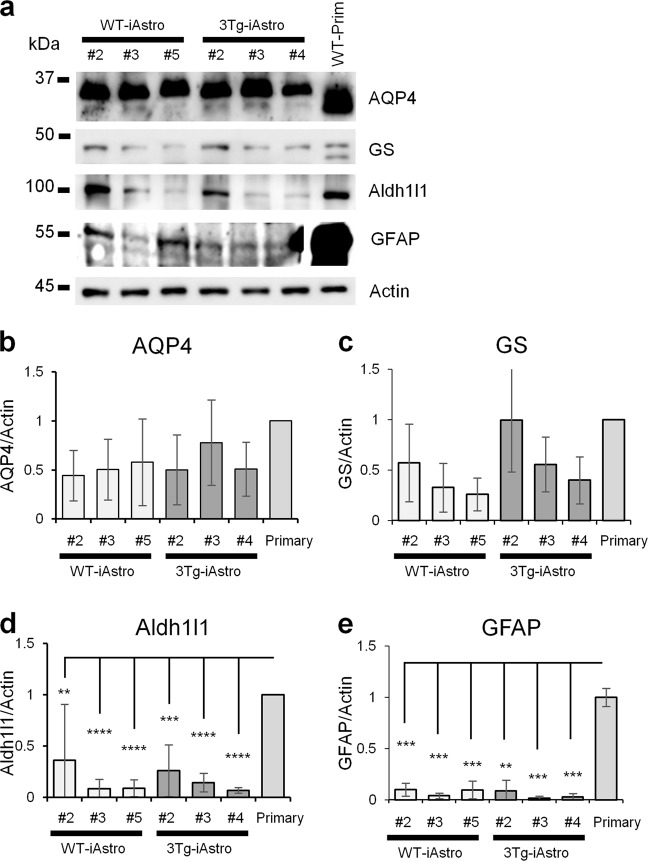
Fig. 2. Western blot analysis and quantification of astroglial marker proteins Aqp4, GS, Aldh1l1 and GFAP.
Western blot analysis (a) was performed from four independently generated iAstro lines for each genotype (WT-iAstro#2, #3, #5 and #6, and 3Tg-iAstro#2, #3, #4 and #6). Each point represents mean ± SEM of 3 independent experiments. Actin was used as loading control. ANOVA followed by Tukey’s post-hoc test was used for statistical analysis. For Aqp4 (b) and GS (c) there were no significant differences. For Aldh1l1 (d) and GFAP (e) the differences were significant for iAstro lines vs primary astrocytes: **p < 0.01; ***p < 0.001; ****p < 0.0001

