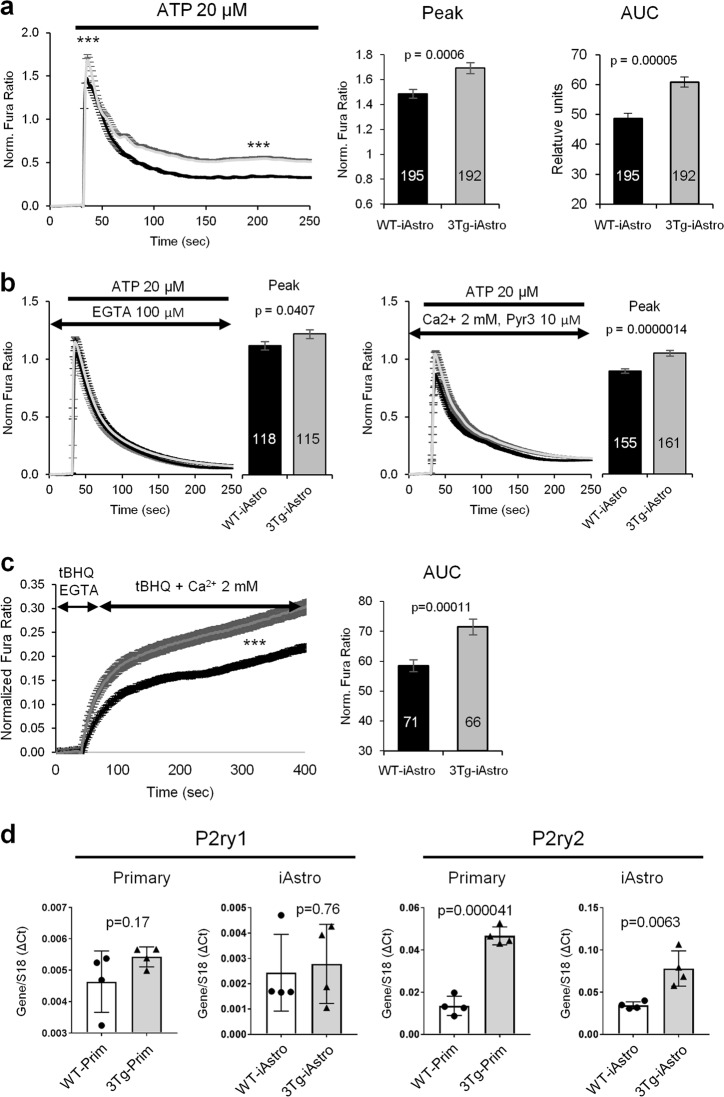
Fig. 4. Calcium signaling alterations in 3Tg-iAstro as compared to WT-iAstro lines.
a Fura-2-loaded WT- and 3Tg-iAstro cells were stimulated with 20 μM ATP in Ca2+-containing KRB solution. Data are expressed as mean of peak ± SEM or mean of area under the curve (AUC) ± SEM of 195 cells (WT-iAstro#2; 1.39 ± 0.035 norm. Fura ratio) and 192 cells (3Tg-iAstro#2; 1.69 ± 0.045 norm. Fura ratio, p = 0.0006) from 12 coverslips from 3 independent experiments. ***p < 0.001. b WT- and 3Tg-iAstro cells were stimulated with 20 μM ATP in Ca2+-free KRB solution (left panel; mean of peak ± SEM of 118 cells (WT-iAstro#2; 1.19 ± 0.03 norm. Fura ratio) and 115 cells (3Tg-iAstro#2; 1.31 ± 0.039 norm. Fura ratio, p = 0,040) or in Ca2+-containing KRB supplemented with 10 μM Pyr3, a store-operated Ca2+ channel blocker (right panel; mean of peak ± SEM of 155 cells (WT-iAstro#2; 0.89 ± 0.018 norm. Fura ratio) and 161 cells (3Tg-iAstro#2; 1.05 ± 0.025 norm. Fura ratio, p = 0.000001). c Fura-2-loaded cells were depleted of Ca2+ with 20 μM tBHQ (a SERCA blocker) in Ca2+-free KRB for 5 min after which Ca2+ was re-added and Fura-2 ratio was measured. Data are expressed as mean ± SEM of AUC of 71 WT-iAstro#2 cells (58.51 ± 1.94 AUC of norm. Fura ratio) and 66 3Tg-iAstro#2 cells (71.5 ± 1.64 AUC of norm. Fura ratio, p = 0.00011) from 8 coverslips from 3 independent experiments. d Real-time PCR of P2ry1 (left graphs) and P2ry2 (right graph) from primary astrocytes and iAstro lines. Values represent mean ± SD ΔC(t) of gene/S18 of four independent cultures. Unpaired two-tailed Student’s t-test was used for statistical analysis

