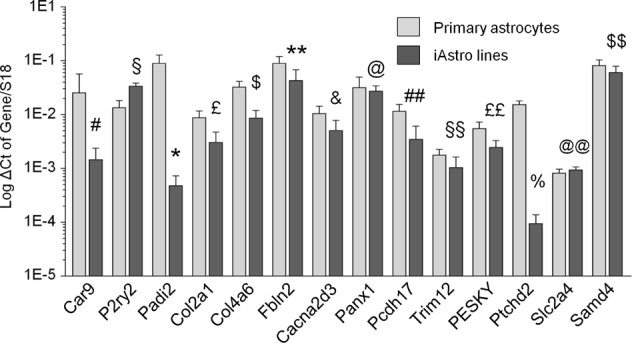
Fig. 5. Comparison of transcriptional levels of selected genes between primary astrocyte cultures and WT-iAstro cells.

The graph shows log scale of RNA levels for specific genes detected in primary mouse hippocampal astrocytes (light gray bars) and in four WT-iAstro lines (#2, #3, #5, #6) (dark gray bars). Data are expressed as mean ± SD ΔC(t) of gene/S18 of four independent cultures. Unpaired two-tailed Student’s t-test was used for statistical analysis; #p = 0.17; §p = 0.00054; *p = 0.0028; £p = 0.012; $p = 0.0019; **p = 0.048; &p = 0.055; @p = 0.064; ##p = 0.013; §§p = 0.091;££p = 0.019; %p = 0.00002; @@p = 0.021; $$p = 0.19
